

In recent years, the number of cases with severe Plasmodium vivax malaria has shown an increasing trend. It is, therefore, important to identify routine laboratory markers that best characterize the acute disease phase and can serve as a tool for clinical follow-up of patients. In a cohort study, we followed 87 patients with acute P. vivax monoinfection acquired in an endemic region of the Brazilian Amazon. Forty-two different biochemical and hematological parameters frequently tested in clinical routine were evaluated at the acute phase and the convalescent phase. A total of 42 laboratory tests were performed: biochemical parameters measured were serum lipids levels, aminotransferases, bilirubin, amylase, glucose, urea, creatinine, albumin, globulin, uric acid, C-reactive protein, and alpha-1-acid glycoprotein. Hematological parameters included total and differential white blood cell and platelet counts, hemoglobin concentration, mean platelet volume, platelet width distribution, and plateletcrit. Our results show that several biochemical and hematological parameters were associated with acute phase P. vivax malaria and these parameters reverted to normal values in the convalescent phase. The use of these parameters during diagnosis and follow-up of the infection is a useful clinical tool to evaluate the clinical course and therapeutic response of patients with uncomplicated vivax malaria.
Worldwide, malaria is one of the major parasitic diseases. It affected 219 million people in 2017 and was the cause of 435,000 deaths, making it a major public health problem.1 Currently, 40% of the world's population is exposed to malaria, with 2.9 billion individuals, especially those living in tropical and subtropical regions, likely to acquire Plasmodium vivax malaria. In Brazil, the transmission of malaria is mainly concentrated in the Amazon region (99.9% of all reported Brazilian malaria cases are from this region), with P. vivax accounting for 90% of these cases.2
P. vivax infection has been considered to be an uncomplicated disease for many years. However, recently, numerous cases of severe disease course and deaths have been reported, with complications in several organs as were not observed previously. Studies have shown that the risk of malaria complications varies substantially across the world, and there is a regional disease profile.1–7
In view of the new clinical picture of P. vivax malaria, some new laboratory parameters, which were not previously evaluated in the medical routine, are being evaluated as biomarkers for disease assessment.8–12 To contribute to the assessment of patient with the infection, it was necessary to investigate new laboratory parameters associated with the acute phase of vivax malaria. Significant changes in these markers from acute to convalescent clinical phases might be useful in monitoring the clinical evolution and the initial patient response to malaria treatment.13–15 This study reports some new laboratory markers associated with the acute phase of P. vivax malaria and we, hereby, suggest that they are useful tools in the management of patients with vivax malaria infection.
Material and methodsThis was a descriptive historical cohort in which 189 patients from the Brazilian Amazon Region diagnosed with P. vivax monoinfection by microscopic16 and molecular17 methods who attended the Reference Center for Diagnosis and Treatment of Malaria in the state of Mato-Grosso, Brazil from 2010 to 2016. Of these, a total of 87 (46%) patients had clinical and laboratory results from both acute and convalescent phases in the database and were included in the study. Information from the convalescent phase was collected at the time the patients returned to check for cure between 7 (25th percentile) and 12 days (75th percentile) after diagnosis and treatment initiation.
Patients with comorbidities, diagnosed with mixed malaria, used antibiotics in the last seven days prior to care, or already on treatment at the time of care were not included in the study.
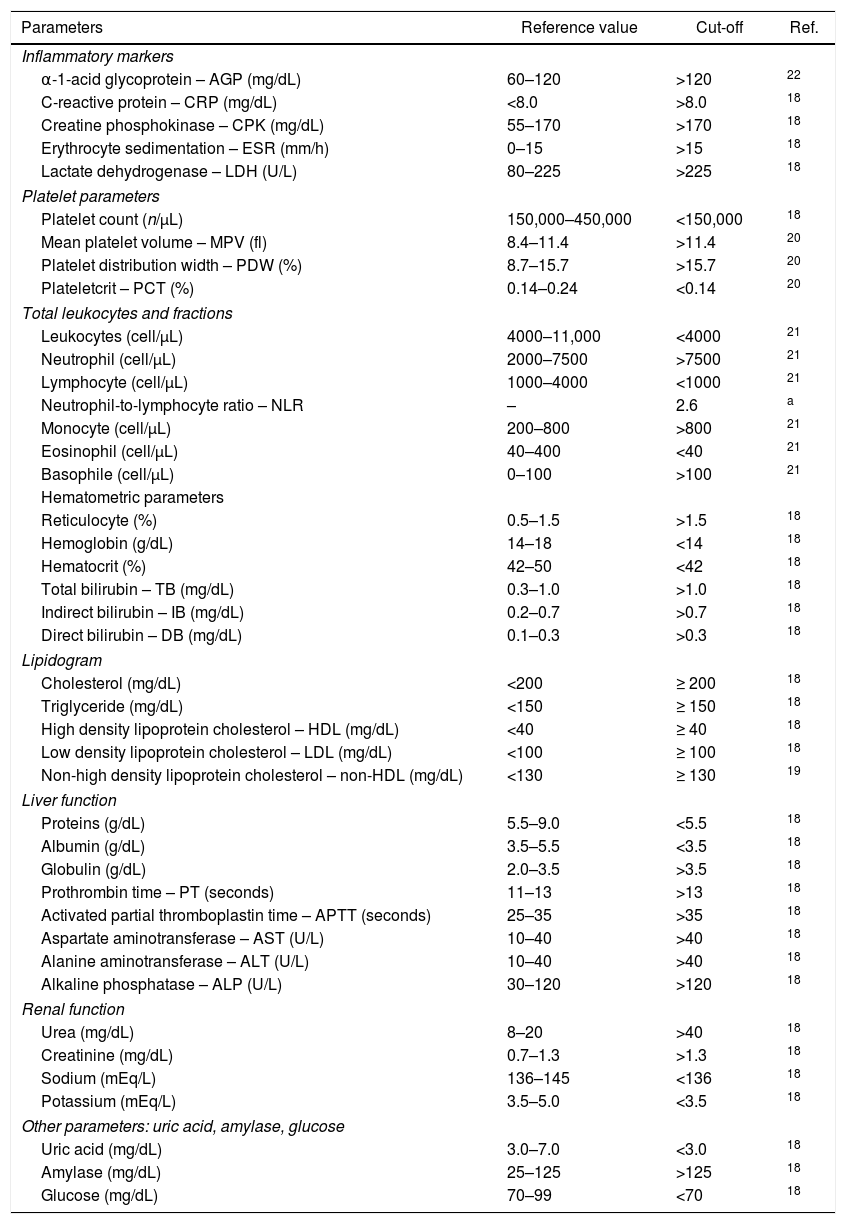
Forty-two different laboratory parameters (Table A1) were analyzed in both clinical phases; these included lipid profile, liver function, renal function, coagulation factors, total protein and fractions, hematological parameters, including hemoglobin concentration, total and differential white blood cell counts, platelet count, and related parameters, conventional acute inflammatory markers, and concentrations of uric acid, amylase, and glucose. Determination of alterations in these parameters was based on the reference intervals established for each test (Table A1).18–22 All the hematological and biochemical exams were performed using automated equipment, following the standards of laboratory quality control (Pentra 80 Hematology Counter Horiba Medical, Montpellier, France; and CT 600i Automated Analyzer Wiener Laboratories, Rosario, Argentina).
In this cohort study, the above mentioned hematological and biochemical parameters were compared during acute and convalescent phases of disease. Therefore, a control group was not considered necessary.
require a, since the patient's outcome in the acute phase is being compared with himself in the convalescent phase using the normal range limit as a cutoff point.
The present study was not intended to gather information regarding severe vivax malaria, but to describe what was found in the population studied. This laboratory information represents the profile of these Brazilian Amazon patients treated at a reference center during the period described.
Statistical analysisThe statistical analyses were performed using Stata Analysis and Statistical Package version 12 (StataCorp LC, Texas, USA) software. Descriptive analysis of all variables was performed as the quartile distribution. To investigate the changes in the values of the laboratory parameters between acute and the convalescent phases, the data (all non-parametric, because of non-normality in the Shapiro–Wilk test) were compared with the Wilcoxon matched pair signed-rank test. The Wilcoxon test is more appropriate when it comes to comparative results, as is our case with results at two moments, one in the acute phase and one in the convalescence phase.
The cutoff point of each parameter for change identification was established within the normal range limits.18–22 The proportion of patients with values above or below the selected cut-off point was compared between the groups of acute and convalescent phases of vivax malaria. This analysis was performed in a 2×2 table and the results of chi-square test and the 95% confidence interval of the odds ratio were compared between the groups. For all statistical analyses, the level of significance was 5% (α error=0.05).
The sample number of the present study represents the population at a confidence level of 95% with a sampling error of 8%.
Ethical considerationsEthical and methodological aspects of this study were approved by the Ethical Committee of the Julio Muller School Hospital in Cuiabá, Mato Grosso, Brazil (protocol # 1.001.158/2015), according to the National Brazilian Health Council (Resolutions 196/96 and 466/12). All participants were informed about the objectives and procedures of the study, and participated voluntarily by giving written informed consent.
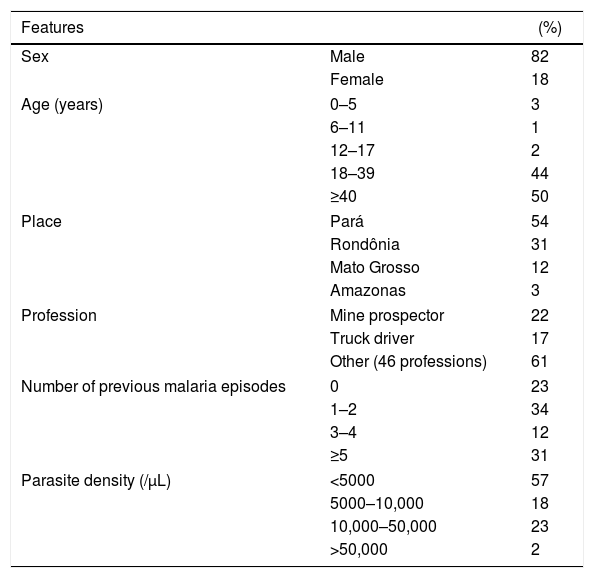
Results and discussionParticipantsThe patients included in the study were mostly male (82%), with a mean (±SD) age of 40 (±15) years. The majority were occupationally involved in risky activities for malaria transmission, such as mining and truck driving. All cases were from the Brazilian Amazon, a region endemic for malaria, and 23% were prime-infected; the other cases reported at least one previous malaria episode at the time of diagnosis. The median parasite density was 4000/mm3, ranging from 1500/mm3 (percentile 25) to 10,000/mm3 (percentile 75) (Table 1).
Characteristics of 87 patients with acute Plasmodium vivax malaria.
| Features | (%) | |
|---|---|---|
| Sex | Male | 82 |
| Female | 18 | |
| Age (years) | 0–5 | 3 |
| 6–11 | 1 | |
| 12–17 | 2 | |
| 18–39 | 44 | |
| ≥40 | 50 | |
| Place | Pará | 54 |
| Rondônia | 31 | |
| Mato Grosso | 12 | |
| Amazonas | 3 | |
| Profession | Mine prospector | 22 |
| Truck driver | 17 | |
| Other (46 professions) | 61 | |
| Number of previous malaria episodes | 0 | 23 |
| 1–2 | 34 | |
| 3–4 | 12 | |
| ≥5 | 31 | |
| Parasite density (/μL) | <5000 | 57 |
| 5000–10,000 | 18 | |
| 10,000–50,000 | 23 | |
| >50,000 | 2 | |
Most patients had fever, chills, myalgia, headache, epigastric pain and vomiting, the classic symptoms of malaria. According to WHO13 criteria there were no cases of severely ill patients. Jaundice and enlarged spleen and liver, classic clinical signs of malaria, were present in some cases.23
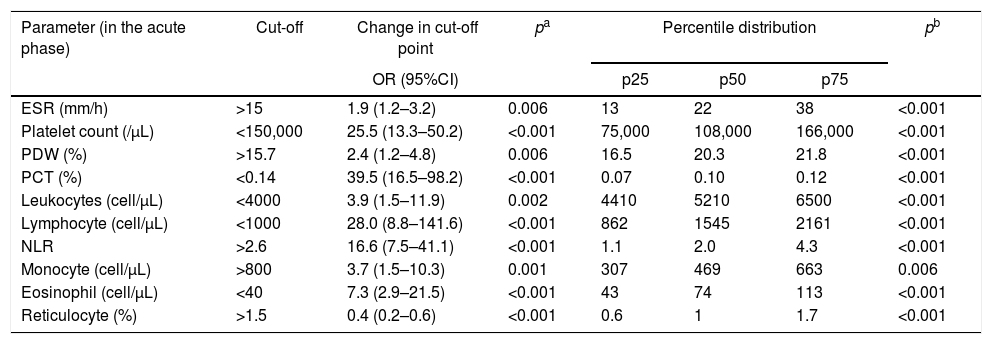
Laboratory parametersOut of the 42 laboratory parameters analyzed, 22 were varied significantly from acute phase to convalescent phase. Odds ratio above 1.0 meant a greater the probability of an abnormal result in the acute phase, whereas odds ratio below 1.0 meant a greater the probability of an abnormal result in the convalescent phase. The 10 laboratory parameters that were altered in the acute phase and returned to normal in the convalescent phase were C-reactive protein (CRP), plateletcrit (PCT), lymphocyte count, platelet count, total (TB), direct (DB) and indirect bilirubin (IB), neutrophil-to-lymphocyte ratio (NLR), α-1-acid glycoprotein (AGP), and eosinophil count (Tables 2 and 3, and Fig. 1).
Comparison of the proportions and percentile distribution of hematological parameters in 87 patients in acute phase of Plasmodium vivax malaria.
| Parameter (in the acute phase) | Cut-off | Change in cut-off point | pa | Percentile distribution | pb | ||
|---|---|---|---|---|---|---|---|
| OR (95%CI) | p25 | p50 | p75 | ||||
| ESR (mm/h) | >15 | 1.9 (1.2–3.2) | 0.006 | 13 | 22 | 38 | <0.001 |
| Platelet count (/μL) | <150,000 | 25.5 (13.3–50.2) | <0.001 | 75,000 | 108,000 | 166,000 | <0.001 |
| PDW (%) | >15.7 | 2.4 (1.2–4.8) | 0.006 | 16.5 | 20.3 | 21.8 | <0.001 |
| PCT (%) | <0.14 | 39.5 (16.5–98.2) | <0.001 | 0.07 | 0.10 | 0.12 | <0.001 |
| Leukocytes (cell/μL) | <4000 | 3.9 (1.5–11.9) | 0.002 | 4410 | 5210 | 6500 | <0.001 |
| Lymphocyte (cell/μL) | <1000 | 28.0 (8.8–141.6) | <0.001 | 862 | 1545 | 2161 | <0.001 |
| NLR | >2.6 | 16.6 (7.5–41.1) | <0.001 | 1.1 | 2.0 | 4.3 | <0.001 |
| Monocyte (cell/μL) | >800 | 3.7 (1.5–10.3) | 0.001 | 307 | 469 | 663 | 0.006 |
| Eosinophil (cell/μL) | <40 | 7.3 (2.9–21.5) | <0.001 | 43 | 74 | 113 | <0.001 |
| Reticulocyte (%) | >1.5 | 0.4 (0.2–0.6) | <0.001 | 0.6 | 1 | 1.7 | <0.001 |
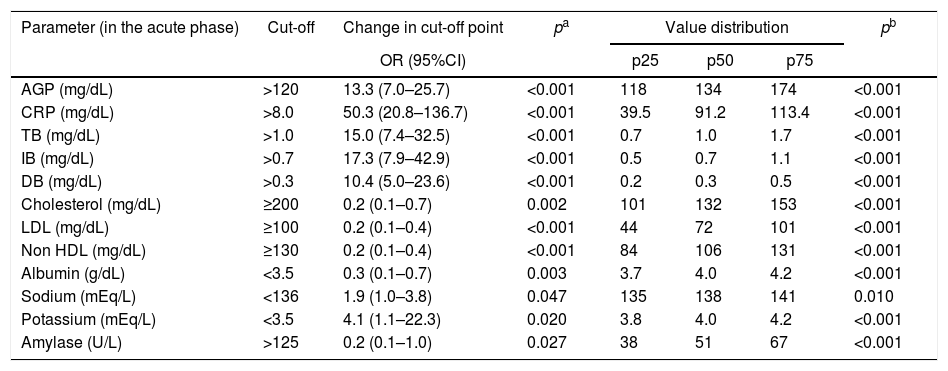
Comparison of the proportions and percentile distribution of biochemical parameters of blood in 87 patients in acute phase of Plasmodium vivax malaria.
| Parameter (in the acute phase) | Cut-off | Change in cut-off point | pa | Value distribution | pb | ||
|---|---|---|---|---|---|---|---|
| OR (95%CI) | p25 | p50 | p75 | ||||
| AGP (mg/dL) | >120 | 13.3 (7.0–25.7) | <0.001 | 118 | 134 | 174 | <0.001 |
| CRP (mg/dL) | >8.0 | 50.3 (20.8–136.7) | <0.001 | 39.5 | 91.2 | 113.4 | <0.001 |
| TB (mg/dL) | >1.0 | 15.0 (7.4–32.5) | <0.001 | 0.7 | 1.0 | 1.7 | <0.001 |
| IB (mg/dL) | >0.7 | 17.3 (7.9–42.9) | <0.001 | 0.5 | 0.7 | 1.1 | <0.001 |
| DB (mg/dL) | >0.3 | 10.4 (5.0–23.6) | <0.001 | 0.2 | 0.3 | 0.5 | <0.001 |
| Cholesterol (mg/dL) | ≥200 | 0.2 (0.1–0.7) | 0.002 | 101 | 132 | 153 | <0.001 |
| LDL (mg/dL) | ≥100 | 0.2 (0.1–0.4) | <0.001 | 44 | 72 | 101 | <0.001 |
| Non HDL (mg/dL) | ≥130 | 0.2 (0.1–0.4) | <0.001 | 84 | 106 | 131 | <0.001 |
| Albumin (g/dL) | <3.5 | 0.3 (0.1–0.7) | 0.003 | 3.7 | 4.0 | 4.2 | <0.001 |
| Sodium (mEq/L) | <136 | 1.9 (1.0–3.8) | 0.047 | 135 | 138 | 141 | 0.010 |
| Potassium (mEq/L) | <3.5 | 4.1 (1.1–22.3) | 0.020 | 3.8 | 4.0 | 4.2 | <0.001 |
| Amylase (U/L) | >125 | 0.2 (0.1–1.0) | 0.027 | 38 | 51 | 67 | <0.001 |
Comparison of the changes in the cut-off points between acute and convalescent phases, as determined by odds ratio (CI95%) and chi-square test.
Comparison of the values of parameters between acute and convalescent phases, as determined by Wilcoxon matched pair signed-rank test.
Abbreviations: AGP, α-1-acid glycoprotein; CRP, C-reactive protein; TB, total bilirubin; IB, indirect bilirubin; DB, direct bilirubin; LDL, low density lipoprotein cholesterol; non-HDL, non high density lipoprotein cholesterol.
 between the acute and convalescent phases of vivax malaria.")
As described for other inflammatory diseases,24 CRP was also increased in acute malaria and this increase was confirmed to be associated with the P. vivax acute phase in the present study. The median CRP in the acute phase dropped from 91 to 6.6mg/dL in the convalescent phase (p<0.001). The proportion of patients with increased CRP levels in the acute phase was 50-fold higher (95%CI: 20.8–136.7; p<0.001) than in the convalescent phase (Table 3 and Table A3). Similarly, α-1-acid glycoprotein (AGP) and erythrocyte sedimentation rate (ESR) were significant higher in the acute phase compared to results in the convalescent phase. These findings suggest that CRP, AGP, and ESR could be used to establish the “baseline” in P. vivax malaria that could be subsequently used to monitor the therapeutic response of patients.25 In the present study lactate dehydrogenase (LDH) presented a later clearance and remained altered in the convalescent phase, and creatine phosphokinase (CPK) did not change in any of the phases (Table A3).
The probability of a low platelet count in the acute phase was 25-fold higher (95%CI: 13.3–50.2; p<0.001) than in the convalescent phase. The probability of patients with low PCT in the acute phase was 39-fold (95%CI: 16.5–98.2; p<0.001) higher. In addition, a platelet distribution width (PDW) above normal was 2.4-fold (95%CI: 1.2–4.8; p=0.006) more likely in the acute phase (Table 2 and Table A2). Compared with the PDW, the mean platelet volume (MPV) was significantly higher in the acute phase (p<0.001). All these platelet parameters are indicative of early production of larger and more efficient platelets. In fact, one study showed that platelets with larger volumes are functionally more active.26 Both PCT and platelet count can also help in the clinical evaluation of patients with acute vivax malaria.
Mechanisms have been proposed to explain thrombocytopenia during malaria episodes, including platelet destruction by immune mechanisms; low medullary platelet production; low thrombopoietin synthesis; platelet sequestration in the spleen; and systemic sequestration. These changes are transient and patients usually recover completely after malaria treatment. In addition, thrombocytopenia is associated with a higher risk for hemorrhage.27–29
The WBC count in malaria could be normal but several studies have shown that malaria patients have leukopenia associated with relative increase of neutrophil count in peripheral blood.30,31 The probability of low lymphocyte and eosinophil counts were 28-fold (95%CI: 8.8–141.6; p<0.001) and 7-fold (95%CI: 2.9–21.5; p<0.001) higher in the acute phase. On the other hand, the probability of an increased NLR was 16-fold (95%CI: 16.6 (7.5–41.1); p<0.001) in the acute phase. In our study, the median of the NLR changed from 2.5 in the acute phase to 1.4 in the convalescent phase (Table 2 and Table A2).
Because of a decrease in the number of lymphocytes and increase in neutrophil count in P. vivax malaria, the NLR index is considered to be a novel inflammatory biomarker in malaria, indicating poor prognosis; greater the difference between these parameters, more severe is the disease.32 However, in our study, the evaluation of lymphocyte number alone was better as an acute phase marker than the NLR index. Our data is in line with a study conducted in Colombia in 2015 wherein P. vivax malaria patients with clinical complications had decreased leukocyte, lymphocyte, and eosinophil counts, and showed an increase in monocyte and neutrophil counts.33
In our study the basophil count showed a significant decrease in the acute phase. So far, this had not been reported in malaria; in the literature, this reduction has been described in association with depression,34 urticaria,35 bladder cancer,36 hyperthyroidism, and allergy.37
Reticulocyte count was in the normal range in the acute phase and increased in the convalescent phase; this shows a late response of this marker, which is not good for an acute phase marker. Hemoglobin and hematocrit are also considered by WHO as criteria for the severity of malaria.13,29 Although hemoglobin and hematocrit values in the acute phase were decreased, they were not significantly different from those in the convalescence phase, which could be explained by the delay in the erythropoiesis response after erythrocyte disruption (Table A2).
During infection, there is an obvious loss of infected red blood cells due to parasite maturation, but many uninfected red blood cells are also destroyed due to antibody sensitization, membrane alterations, increased reticuloendothelial activity in the spleen and suppression of erythropoiesis, contributing to the reduction in red blood cells.38,39
Regarding biochemical serum parameters, other markers were higher in the acute phase of P. vivax malaria such as IB (OR: 17.3, 95%CI: 7.9–42.9; p<0.001), DB (OR: 10.4, 95%CI: 5.0–23.6; p<0.001), sodium (OR: 1.9, 95%CI: 1.0–3.8; p=0.047), and potassium (OR: 4.1, 95%CI: 1.1–22.3; p=0.020). On the other hand, serum total cholesterol (OR: 0.2, 95%CI: 0.1–0.7; p=0.002), LDL (OR: 0.2, 95%CI: 0.1–0.4; p<0.001), non-HDL (OR: 0.2, 95%CI: 0.1–0.4; p<0.001), albumin (OR: 0.3, 95%CI: 0.1–0.7; p=0.003), and amylase (OR: 0.2, 95%CI: 0.1–1.0; p=0.027) were reduced in the acute phase (Table 3 and Table A3). Total bilirubinemia is one of the markers for severity of P. vivax,13 but indirect hyperbilirubinemia, the fraction produced due to hemolysis, was better correlated with the P. vivax acute phase in the studied patients, compared to DB and TB.
The differences found in lipid profile are in line with other reports.40–42 Total cholesterol and its fractions, LDL, non-HDL, and HDL, decreased in the acute phase, whereas triglyceride values were increased (Table A3). It has been suggested that lipid changes are part of an acute phase reaction, which can be attributed, in part, to plasma leakage induced by increased capillary permeability and hemozoin formation.43,44 Another possibility is that cell division of parasites during blood schizogony, to form new merozoites, is highly dependent on the intra-erythrocytic cholesterol. Thus, to ensure their development, malaria parasites must extract lipids from their hosts.45
In the present study, the patients had lower albumin levels (p<0.001) in the acute phase, but had normal globulin levels (Table 3). Probably, this hypoalbuminemia is caused by hepatic impairment in malaria, as albumin is synthesized in the liver. Similarly, the prothrombin time (PT) was higher in the acute phase and prothrombin was also synthesized in the liver (p=0.001).13,46 Other liver parameters showed no changes in the present study.
There was no difference in creatinine (p=0.541), urea (p=0.062), and blood glucose (p=0.080) levels between acute and convalescent phases. In fact, only one patient showed glycemia below 60mg/dL; this is not frequent among patients with P. vivax malaria from the Amazon region. In our research, levels of convalescent phase amylase were higher than in the acute phase, demonstrating late increase of this enzyme or decrease in the acute phase, which has not been reported so far. The mechanisms leading to amylase change in malaria have not yet been elucidated.47 Sodium and potassium levels were significantly more reduced in the acute phase compared to that in the convalescent phase. Decreased levels of sodium and potassium have been reported in other studies on severe P. vivax malaria48,49 (Table A3).
The results of the present study clearly showed that several hematological and biochemical parameters are altered in the acute phase of vivax malaria, but they revert to normal values in the convalescence phase.
ConclusionThe 10 most relevant parameters for evaluating patients in the acute phase of P. vivax malaria were C-reactive protein, indirect bilirubin, neutrophil-to-lymphocyte ratio, total bilirubin, α-1-acid glycoprotein, and direct bilirubin, which increased expressively in the acute phase. In contrast, plateletcrit, lymphocyte, platelet and eosinophil counts were significantly reduced in the acute phase. All these parameters reverted to normal values during the convalescence period. Considering that these blood parameters are widely used in medical routine, these findings suggest that these parameters could help physicians in the first clinical evaluation and during therapeutic follow-up of uncomplicated vivax malaria infected patients.
Funding sourcesThe present research was funded by governmental sources: Fundação de Amparo a Pesquisa de Mato Grosso (FAPEMAT) and the Conselho Nacional de Desenvolvimento Científico e Tecnológico (CNPq).
Conflicts of interestThe authors declare no conflict of interest.
We thank colleagues from the Univag University Center, Federal University of Mato Grosso and Julio Muller School Hospital, who collaborated in various phases of this study.
Reference values used as cut-off points, considering a population that best represents the study sample.
| Parameters | Reference value | Cut-off | Ref. |
|---|---|---|---|
| Inflammatory markers | |||
| α-1-acid glycoprotein – AGP (mg/dL) | 60–120 | >120 | 22 |
| C-reactive protein – CRP (mg/dL) | <8.0 | >8.0 | 18 |
| Creatine phosphokinase – CPK (mg/dL) | 55–170 | >170 | 18 |
| Erythrocyte sedimentation – ESR (mm/h) | 0–15 | >15 | 18 |
| Lactate dehydrogenase – LDH (U/L) | 80–225 | >225 | 18 |
| Platelet parameters | |||
| Platelet count (n/μL) | 150,000–450,000 | <150,000 | 18 |
| Mean platelet volume – MPV (fl) | 8.4–11.4 | >11.4 | 20 |
| Platelet distribution width – PDW (%) | 8.7–15.7 | >15.7 | 20 |
| Plateletcrit – PCT (%) | 0.14–0.24 | <0.14 | 20 |
| Total leukocytes and fractions | |||
| Leukocytes (cell/μL) | 4000–11,000 | <4000 | 21 |
| Neutrophil (cell/μL) | 2000–7500 | >7500 | 21 |
| Lymphocyte (cell/μL) | 1000–4000 | <1000 | 21 |
| Neutrophil-to-lymphocyte ratio – NLR | – | 2.6 | a |
| Monocyte (cell/μL) | 200–800 | >800 | 21 |
| Eosinophil (cell/μL) | 40–400 | <40 | 21 |
| Basophile (cell/μL) | 0–100 | >100 | 21 |
| Hematometric parameters | |||
| Reticulocyte (%) | 0.5–1.5 | >1.5 | 18 |
| Hemoglobin (g/dL) | 14–18 | <14 | 18 |
| Hematocrit (%) | 42–50 | <42 | 18 |
| Total bilirubin – TB (mg/dL) | 0.3–1.0 | >1.0 | 18 |
| Indirect bilirubin – IB (mg/dL) | 0.2–0.7 | >0.7 | 18 |
| Direct bilirubin – DB (mg/dL) | 0.1–0.3 | >0.3 | 18 |
| Lipidogram | |||
| Cholesterol (mg/dL) | <200 | ≥ 200 | 18 |
| Triglyceride (mg/dL) | <150 | ≥ 150 | 18 |
| High density lipoprotein cholesterol – HDL (mg/dL) | <40 | ≥ 40 | 18 |
| Low density lipoprotein cholesterol – LDL (mg/dL) | <100 | ≥ 100 | 18 |
| Non-high density lipoprotein cholesterol – non-HDL (mg/dL) | <130 | ≥ 130 | 19 |
| Liver function | |||
| Proteins (g/dL) | 5.5–9.0 | <5.5 | 18 |
| Albumin (g/dL) | 3.5–5.5 | <3.5 | 18 |
| Globulin (g/dL) | 2.0–3.5 | >3.5 | 18 |
| Prothrombin time – PT (seconds) | 11–13 | >13 | 18 |
| Activated partial thromboplastin time – APTT (seconds) | 25–35 | >35 | 18 |
| Aspartate aminotransferase – AST (U/L) | 10–40 | >40 | 18 |
| Alanine aminotransferase – ALT (U/L) | 10–40 | >40 | 18 |
| Alkaline phosphatase – ALP (U/L) | 30–120 | >120 | 18 |
| Renal function | |||
| Urea (mg/dL) | 8–20 | >40 | 18 |
| Creatinine (mg/dL) | 0.7–1.3 | >1.3 | 18 |
| Sodium (mEq/L) | 136–145 | <136 | 18 |
| Potassium (mEq/L) | 3.5–5.0 | <3.5 | 18 |
| Other parameters: uric acid, amylase, glucose | |||
| Uric acid (mg/dL) | 3.0–7.0 | <3.0 | 18 |
| Amylase (mg/dL) | 25–125 | >125 | 18 |
| Glucose (mg/dL) | 70–99 | <70 | 18 |
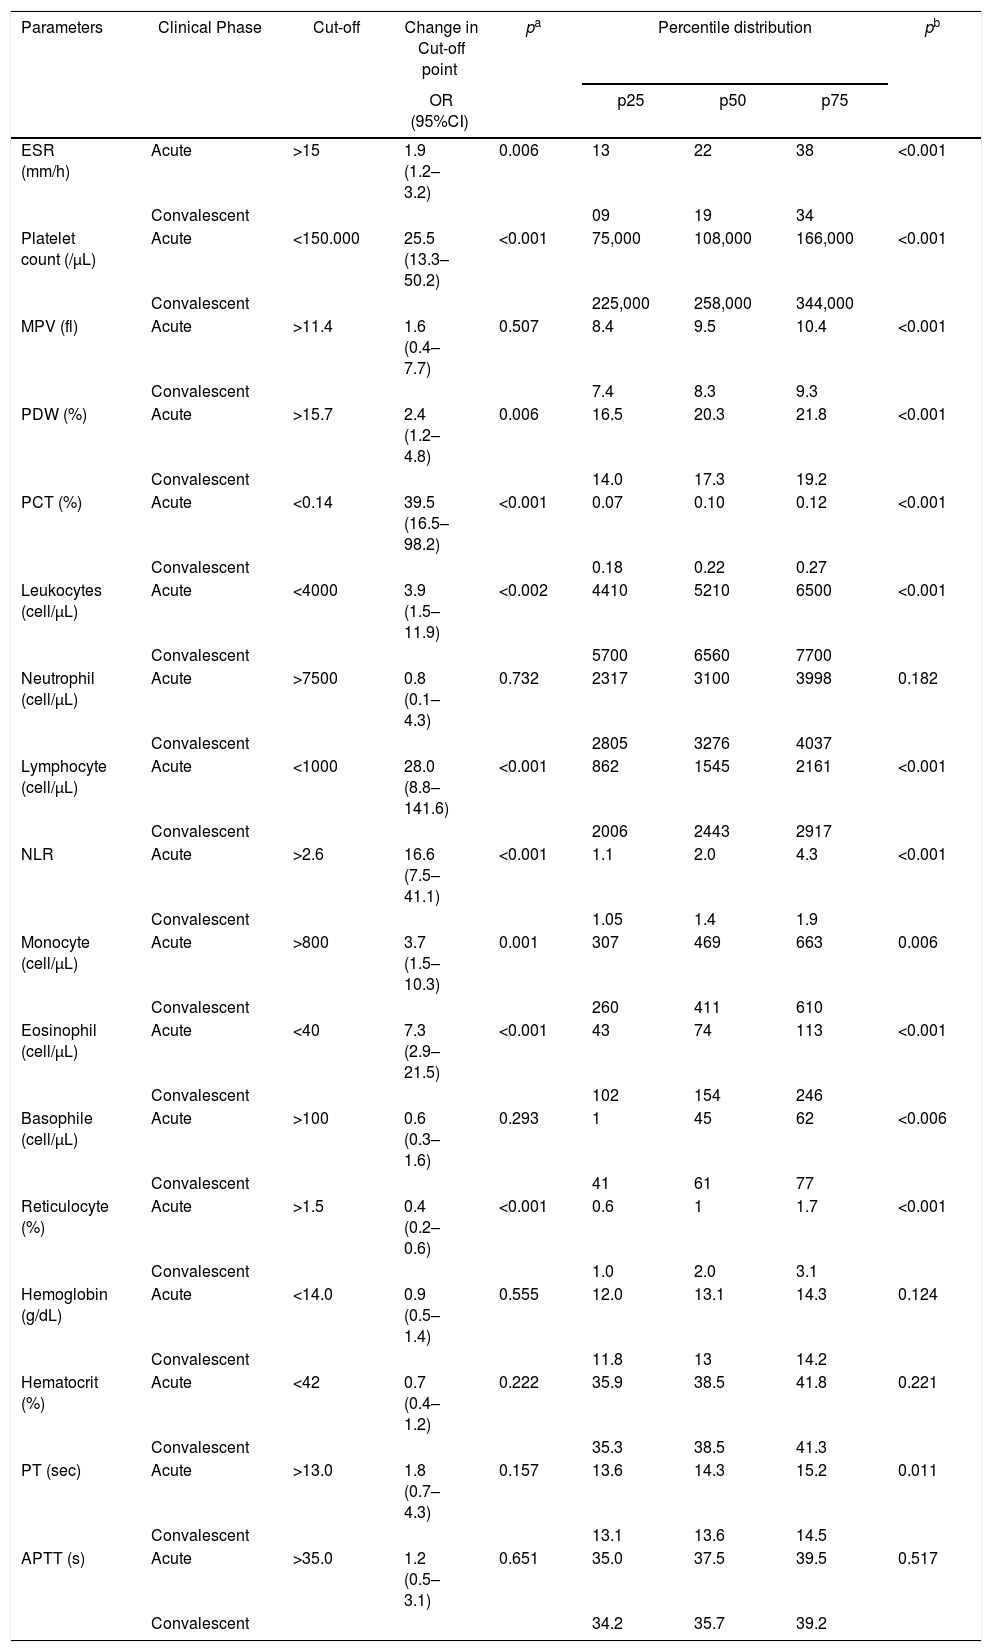
Comparison of the changes in cut-off points and the percentile distribution of hematological parameters of 87 patients in acute and convalescent phases of Plasmodium vivax malaria.
| Parameters | Clinical Phase | Cut-off | Change in Cut-off point | pa | Percentile distribution | pb | ||
|---|---|---|---|---|---|---|---|---|
| OR (95%CI) | p25 | p50 | p75 | |||||
| ESR (mm/h) | Acute | >15 | 1.9 (1.2–3.2) | 0.006 | 13 | 22 | 38 | <0.001 |
| Convalescent | 09 | 19 | 34 | |||||
| Platelet count (/μL) | Acute | <150.000 | 25.5 (13.3–50.2) | <0.001 | 75,000 | 108,000 | 166,000 | <0.001 |
| Convalescent | 225,000 | 258,000 | 344,000 | |||||
| MPV (fl) | Acute | >11.4 | 1.6 (0.4–7.7) | 0.507 | 8.4 | 9.5 | 10.4 | <0.001 |
| Convalescent | 7.4 | 8.3 | 9.3 | |||||
| PDW (%) | Acute | >15.7 | 2.4 (1.2–4.8) | 0.006 | 16.5 | 20.3 | 21.8 | <0.001 |
| Convalescent | 14.0 | 17.3 | 19.2 | |||||
| PCT (%) | Acute | <0.14 | 39.5 (16.5–98.2) | <0.001 | 0.07 | 0.10 | 0.12 | <0.001 |
| Convalescent | 0.18 | 0.22 | 0.27 | |||||
| Leukocytes (cell/μL) | Acute | <4000 | 3.9 (1.5–11.9) | <0.002 | 4410 | 5210 | 6500 | <0.001 |
| Convalescent | 5700 | 6560 | 7700 | |||||
| Neutrophil (cell/μL) | Acute | >7500 | 0.8 (0.1–4.3) | 0.732 | 2317 | 3100 | 3998 | 0.182 |
| Convalescent | 2805 | 3276 | 4037 | |||||
| Lymphocyte (cell/μL) | Acute | <1000 | 28.0 (8.8–141.6) | <0.001 | 862 | 1545 | 2161 | <0.001 |
| Convalescent | 2006 | 2443 | 2917 | |||||
| NLR | Acute | >2.6 | 16.6 (7.5–41.1) | <0.001 | 1.1 | 2.0 | 4.3 | <0.001 |
| Convalescent | 1.05 | 1.4 | 1.9 | |||||
| Monocyte (cell/μL) | Acute | >800 | 3.7 (1.5–10.3) | 0.001 | 307 | 469 | 663 | 0.006 |
| Convalescent | 260 | 411 | 610 | |||||
| Eosinophil (cell/μL) | Acute | <40 | 7.3 (2.9–21.5) | <0.001 | 43 | 74 | 113 | <0.001 |
| Convalescent | 102 | 154 | 246 | |||||
| Basophile (cell/μL) | Acute | >100 | 0.6 (0.3–1.6) | 0.293 | 1 | 45 | 62 | <0.006 |
| Convalescent | 41 | 61 | 77 | |||||
| Reticulocyte (%) | Acute | >1.5 | 0.4 (0.2–0.6) | <0.001 | 0.6 | 1 | 1.7 | <0.001 |
| Convalescent | 1.0 | 2.0 | 3.1 | |||||
| Hemoglobin (g/dL) | Acute | <14.0 | 0.9 (0.5–1.4) | 0.555 | 12.0 | 13.1 | 14.3 | 0.124 |
| Convalescent | 11.8 | 13 | 14.2 | |||||
| Hematocrit (%) | Acute | <42 | 0.7 (0.4–1.2) | 0.222 | 35.9 | 38.5 | 41.8 | 0.221 |
| Convalescent | 35.3 | 38.5 | 41.3 | |||||
| PT (sec) | Acute | >13.0 | 1.8 (0.7–4.3) | 0.157 | 13.6 | 14.3 | 15.2 | 0.011 |
| Convalescent | 13.1 | 13.6 | 14.5 | |||||
| APTT (s) | Acute | >35.0 | 1.2 (0.5–3.1) | 0.651 | 35.0 | 37.5 | 39.5 | 0.517 |
| Convalescent | 34.2 | 35.7 | 39.2 | |||||
Comparison of the changes in cut-off points between acute and convalescent phases, as determined by odds ratio (CI95%) and chi-square test.
Comparison of the values of parameters between acute and convalescent phases, as determined by Wilcoxon matched pair signed-rank test
ESR, erythrocyte sedimentation; MPV, mean platelet volume; PDW, platelet distribution width; PCT, plateletcrit; NLR, neutrophil-to-lymphocyte ratio; PT, prothrombin time; APTT, activated partial thromboplastin time.
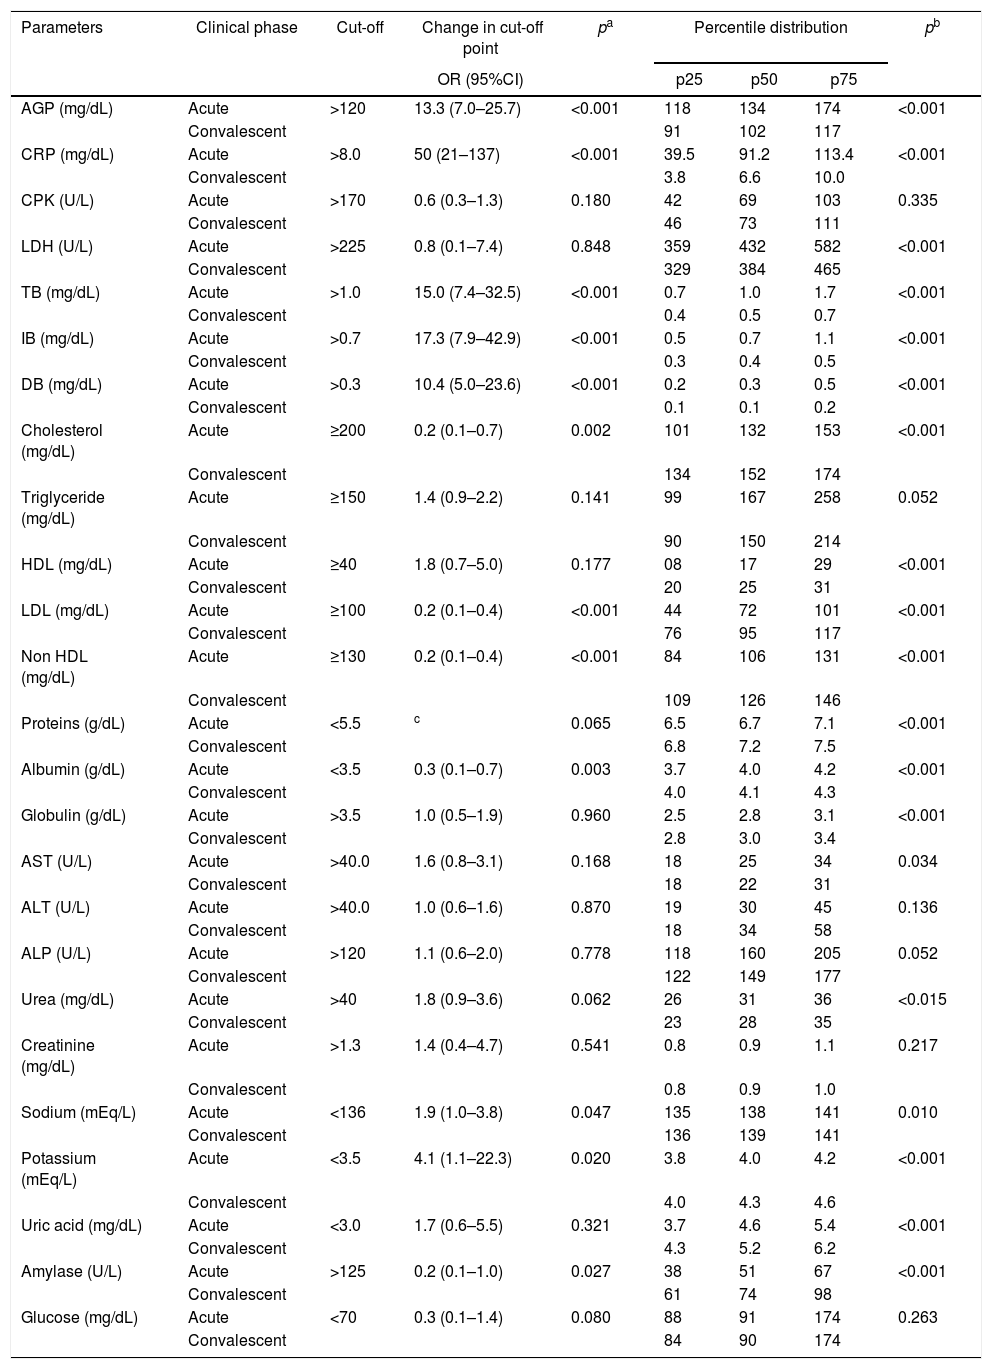
Comparison of the changes in cut-off points and the percentile distribution of blood biochemical parameters of 87 patients in acute and convalescent phases of Plasmodium vivax malaria.
| Parameters | Clinical phase | Cut-off | Change in cut-off point | pa | Percentile distribution | pb | ||
|---|---|---|---|---|---|---|---|---|
| OR (95%CI) | p25 | p50 | p75 | |||||
| AGP (mg/dL) | Acute | >120 | 13.3 (7.0–25.7) | <0.001 | 118 | 134 | 174 | <0.001 |
| Convalescent | 91 | 102 | 117 | |||||
| CRP (mg/dL) | Acute | >8.0 | 50 (21–137) | <0.001 | 39.5 | 91.2 | 113.4 | <0.001 |
| Convalescent | 3.8 | 6.6 | 10.0 | |||||
| CPK (U/L) | Acute | >170 | 0.6 (0.3–1.3) | 0.180 | 42 | 69 | 103 | 0.335 |
| Convalescent | 46 | 73 | 111 | |||||
| LDH (U/L) | Acute | >225 | 0.8 (0.1–7.4) | 0.848 | 359 | 432 | 582 | <0.001 |
| Convalescent | 329 | 384 | 465 | |||||
| TB (mg/dL) | Acute | >1.0 | 15.0 (7.4–32.5) | <0.001 | 0.7 | 1.0 | 1.7 | <0.001 |
| Convalescent | 0.4 | 0.5 | 0.7 | |||||
| IB (mg/dL) | Acute | >0.7 | 17.3 (7.9–42.9) | <0.001 | 0.5 | 0.7 | 1.1 | <0.001 |
| Convalescent | 0.3 | 0.4 | 0.5 | |||||
| DB (mg/dL) | Acute | >0.3 | 10.4 (5.0–23.6) | <0.001 | 0.2 | 0.3 | 0.5 | <0.001 |
| Convalescent | 0.1 | 0.1 | 0.2 | |||||
| Cholesterol (mg/dL) | Acute | ≥200 | 0.2 (0.1–0.7) | 0.002 | 101 | 132 | 153 | <0.001 |
| Convalescent | 134 | 152 | 174 | |||||
| Triglyceride (mg/dL) | Acute | ≥150 | 1.4 (0.9–2.2) | 0.141 | 99 | 167 | 258 | 0.052 |
| Convalescent | 90 | 150 | 214 | |||||
| HDL (mg/dL) | Acute | ≥40 | 1.8 (0.7–5.0) | 0.177 | 08 | 17 | 29 | <0.001 |
| Convalescent | 20 | 25 | 31 | |||||
| LDL (mg/dL) | Acute | ≥100 | 0.2 (0.1–0.4) | <0.001 | 44 | 72 | 101 | <0.001 |
| Convalescent | 76 | 95 | 117 | |||||
| Non HDL (mg/dL) | Acute | ≥130 | 0.2 (0.1–0.4) | <0.001 | 84 | 106 | 131 | <0.001 |
| Convalescent | 109 | 126 | 146 | |||||
| Proteins (g/dL) | Acute | <5.5 | c | 0.065 | 6.5 | 6.7 | 7.1 | <0.001 |
| Convalescent | 6.8 | 7.2 | 7.5 | |||||
| Albumin (g/dL) | Acute | <3.5 | 0.3 (0.1–0.7) | 0.003 | 3.7 | 4.0 | 4.2 | <0.001 |
| Convalescent | 4.0 | 4.1 | 4.3 | |||||
| Globulin (g/dL) | Acute | >3.5 | 1.0 (0.5–1.9) | 0.960 | 2.5 | 2.8 | 3.1 | <0.001 |
| Convalescent | 2.8 | 3.0 | 3.4 | |||||
| AST (U/L) | Acute | >40.0 | 1.6 (0.8–3.1) | 0.168 | 18 | 25 | 34 | 0.034 |
| Convalescent | 18 | 22 | 31 | |||||
| ALT (U/L) | Acute | >40.0 | 1.0 (0.6–1.6) | 0.870 | 19 | 30 | 45 | 0.136 |
| Convalescent | 18 | 34 | 58 | |||||
| ALP (U/L) | Acute | >120 | 1.1 (0.6–2.0) | 0.778 | 118 | 160 | 205 | 0.052 |
| Convalescent | 122 | 149 | 177 | |||||
| Urea (mg/dL) | Acute | >40 | 1.8 (0.9–3.6) | 0.062 | 26 | 31 | 36 | <0.015 |
| Convalescent | 23 | 28 | 35 | |||||
| Creatinine (mg/dL) | Acute | >1.3 | 1.4 (0.4–4.7) | 0.541 | 0.8 | 0.9 | 1.1 | 0.217 |
| Convalescent | 0.8 | 0.9 | 1.0 | |||||
| Sodium (mEq/L) | Acute | <136 | 1.9 (1.0–3.8) | 0.047 | 135 | 138 | 141 | 0.010 |
| Convalescent | 136 | 139 | 141 | |||||
| Potassium (mEq/L) | Acute | <3.5 | 4.1 (1.1–22.3) | 0.020 | 3.8 | 4.0 | 4.2 | <0.001 |
| Convalescent | 4.0 | 4.3 | 4.6 | |||||
| Uric acid (mg/dL) | Acute | <3.0 | 1.7 (0.6–5.5) | 0.321 | 3.7 | 4.6 | 5.4 | <0.001 |
| Convalescent | 4.3 | 5.2 | 6.2 | |||||
| Amylase (U/L) | Acute | >125 | 0.2 (0.1–1.0) | 0.027 | 38 | 51 | 67 | <0.001 |
| Convalescent | 61 | 74 | 98 | |||||
| Glucose (mg/dL) | Acute | <70 | 0.3 (0.1–1.4) | 0.080 | 88 | 91 | 174 | 0.263 |
| Convalescent | 84 | 90 | 174 | |||||
Comparison of the changes in cut-off points between acute and convalescent phases, as determined by odds ratio (CI95%) and chi-square test.
Comparison of the values of parameters between acute and convalescent phases, as determined by Wilcoxon matched pair signed-rank test
95% confidence interval not possible because cells with zero
AGP, α-1-acid glycoprotein; CRP, C-reactive protein; CPK, creatine phosphokinase; LDH, lactate dehydrogenase; TB, total bilirubin; IB, indirect bilirubin; DB, direct bilirubin; HDL, high density lipoprotein cholesterol; LDL, low density lipoprotein cholesterol; non-HDL, non-high density lipoprotein cholesterol; AST, aspartate aminotransferase; ALT, alanine aminotransferase; ALP, alkaline phosphatase.
This work was performed at: Universidade Federal de Mato Grosso, Faculdade de Medicina, Cuiabá, Mato Grosso, Brazil.
