Antimicrobial stewardship programs are an efficient way to reduce inappropriate use of antimicrobials and costs; however, supporting data are scarce in middle-income countries. The aim of this study was to evaluate antibiotic use, bacterial susceptibility profiles, and the economic impact following implementation of a broad-spectrum beta-lactam-sparing antimicrobial stewardship program.
MethodsAn interrupted time-series analysis was performed to evaluate antibiotic use and expenditure over a 24-month period (12 months before the antimicrobial stewardship program and in the 12 months after implementation of the antimicrobial stewardship program). Antibiotics were classified into one of two groups: beta-lactam antibiotics and beta-lactam-sparing antibiotics. We also compared the antimicrobial susceptibility profiles of key pathogens in each period.
ResultsBeta-lactam antibiotics use decreased by 43.04 days of therapy/1000 patient-days (p=0.04) immediately following antimicrobial stewardship program implementation, whereas beta-lacta-sparing antibiotics use increased during the intervention period (slope change 6.17 days of therapy/1000 patient-days, p<0.001). Expenditure decreased by $2089.99 (p<0.001) immediately after intervention and was maintained at this level over the intervention period ($−38.45; p=0.24). We also observed that a greater proportion of pathogens were susceptible to cephalosporins and aminoglycosides after the antimicrobial stewardship program.
ConclusionsThe antimicrobial stewardship program significantly reduced the use of broad-spectrum beta-lactam-antibiotics associated with a decrease in expenditure and maintenance of the susceptibility profile in Gram-negative bacteria.
In this century, antimicrobial resistance (AMR) has become a serious threat and a major concern to global public health.1,2 This is particularly relevant in hospital settings where infections due to multidrug-resistant (MDR) microorganisms are more prevalent, and are associated with higher morbidity, mortality, and financial costs.3 AMR-associated infections are considered costly yet avoidable; the United States (US) Centers for Disease Control (CDC) estimates that the direct healthcare costs associated with AMR surpass $20 billion per year in US, with an additional cost to society, for lost productivity, of $35 billion.4 Middle-income countries (Brazil, Russia, India, China, and South Africa; also referred to as BRICS) accounted for three-quarters of the global increase in antibiotic consumption in the past decade.5 However, only a small number of studies have examined strategies to improve antibiotic consumption in these countries.6,7
The high prevalence of extended-spectrum beta-lactamase (ESBL)-producing bacteria in hospitals has been observed worldwide. The prevalence of ESBL-producing Escherichia coli and Klebsiella pneumoniae reached 17.6% and 38.9% in Europe, 8.5% and 8.8% in US, 40.8% and 21.5% in the Asia-Pacific region, and 26.8% and 37.7% in South America, respectively.8–10 Consequently, consumption of “last-resort” antibiotics, such as carbapenems and polymyxins, has increased. Between 2000 and 2010, the global consumption of carbapenems and polymyxins increased by 45% and 13%, respectively,5 followed by an increasing trend until 2015.11 However, antibiotic consumption is a determinant driver for AMR.12–16
Strategies such as antimicrobial stewardship programs (ASP) appear to be an efficient way to improve clinical and microbial outcomes; such programs aim to reduce the inadequate use of antibiotics and the associated expenditure.17,18 The aim of this study was to evaluate antibiotic use, the associated costs, and the bacterial susceptibility profiles after implementation of a broad-spectrum beta-lactam-sparing ASP.
MethodsStudy design and settingThis was a single-center, retrospective time-series analysis study following implementation of an ASP and the evaluation of the associated impact on antibiotic use, expenditure, and antimicrobial susceptibility. The study was conducted through a period of 24 months (pre-intervention period, July 1, 2016 to June 30, 2017; and intervention period, August 1, 2017 to July 31, 2018) at Hospital Universitário Cajuru (HUC). HUC, in the city of Curitiba, Brazil, is a 207-bed, tertiary care, medical and surgical academic teaching hospital, is a referral center for trauma patients with approximately 1100 inpatients and 4800 patient-days per month.
Antimicrobial stewardship programPrior to implementation of the ASP, the concept of rational antibiotic use had already influenced standard practice in our hospital. However, in July 2017, a beta-lactam-sparing ASP was formally initiated. The core members of the ASP team included a new infectious disease physician and a clinical pharmacist. Later, a rotation of physician and pharmacy residents also supported the core team, with further support provided by interns, nurses, infection control practitioners, and another clinical microbiologist. During preparation for the program, during July 2017, the ASP team assessed local microbial resistance profiles and adopted new techniques for microbial identification. The ASP implemented a restrictive policy for dispensing carbapenems and polymyxin by using a hand-filled form, issued new prophylactic and therapeutic protocols for bacterial infection (supplementary material 1), and withdrew unnecessary antibiotics from the hospital formulary. A prospective auditing and feedback process for all antimicrobial prescriptions was adopted and, if necessary, intervention was initiated within 24h. The ASP team worked full-time with the clinical pharmacist and part-time with the infectious disease physician during regular office hours on weekdays. Patients receiving antibiotics were included in the ASP analysis through electronic data from the prescription system. Dose, length of treatment adjustment, de-escalation, route of administration, and side effects were determined under the guidance of a clinical pharmacist.
The protocol for empirical treatment of infections caused by Gram-negative bacteria outlines the substitution of beta-lactam antibiotics (BLAs: carbapenems, piperacillin-tazobactam, or third and fourth-generation cephalosporins) for beta-lactam-sparing antibiotics (BLSAs: aminoglycosides or fluoroquinolones). These options were based on the susceptibility profiles to most local Gram-negative bacteria. In addition, BLSAs are less expensive than BLAs, and alternative formulations of fluoroquinolones are available for oral administration.
Assessment and outcomesThe primary endpoint was monthly use of antibiotics expressed as days of therapy per 1000 patient-days (DOT/1000 patient-days) for both the restricted antibiotics (BLA) and the BLSA19 periods. As a secondary outcome, monthly ATM-related costs to the hospital pharmacy for these groups of antibiotics was analyzed. We used the average vial or tablet purchase cost in United States dollars (USD) for each antibiotic in the two periods. A comparative analysis of the average use and cost of each class of antibiotics was performed between the two periods. In addition, the susceptibility profiles to each of these antibiotics (carbapenems, piperacillin-tazobactam, third and fourth-generation cephalosporins, aminoglycosides, and fluoroquinolones) were also compared between periods; susceptibility profiles were generated for Gram-negative bacteria isolated from clinical samples obtained for the diagnosis of hospital infections.
Statistical analysisTo estimate changes in the level and trends in monthly antibiotic use and expenditure, we used an interrupted time-series (ITS) analysis.20 The model was generated in SPSS 21.0 using the ARIMA method to generate a constant and baseline trend slope and to estimate changes in slope and level before and after intervention.21 We used the Student's t-test or Mann–Whitney test to compare utilization and costs for each class of antibiotics between the two periods. To compare the proportions of susceptible bacteria, we used Fisher's exact test. The month of July 2017 was excluded from the analyses because it was considered a transitional period for implementation and adjustments of antibiotic use protocols, presentation of the new infectious disease physician to prescribers, and mainly because of the introduction of restrictive formularies at the end of July, which may have been a confounder regarding ATM use results. For all analyses, p-values of <0.05 were considered statistically significant. All tests were computed by using SPSS 21.0 and descriptive statistics and graphs were produced in Microsoft™ Excel 2013.
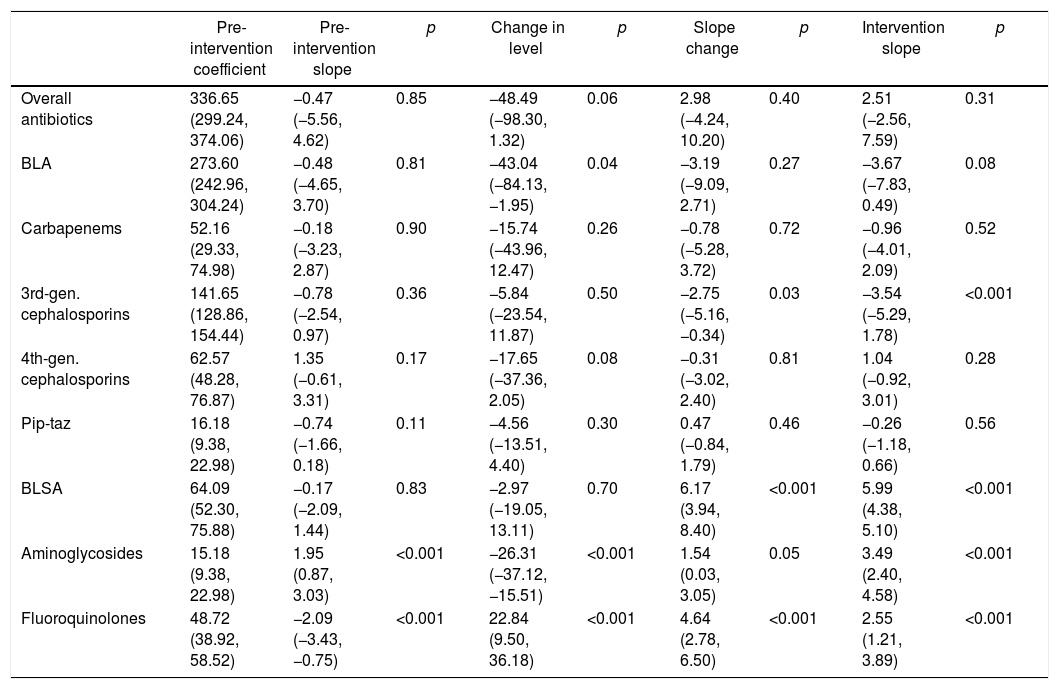
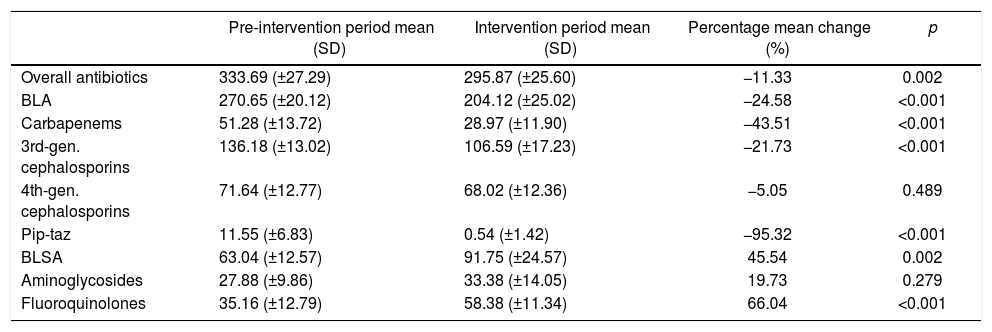
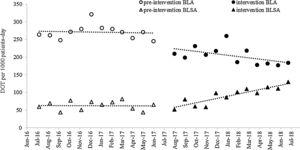
ResultsAntibiotic useThe ITS (Fig. 1) showed that both BLA and BLSA consumption remained stable during the pre-intervention period (−0.48 and −0.17 DOT/1000 patient-days per month, respectively) (Table 1). BLA use decreased by 43.04 DOT/1000 patient-days (p=0.04) immediately following ASP implementation, whereas BLSA use remained constant. Following ASP implementation, the BLA slope change was not significantly altered (−3.20 DOT/1000 patient-days, p=0.27), whereas the BLSA use trend increased (slope change 6.17 DOT/1000 patient-days, p<0.001). In a secondary analysis (Table 2), mean overall antibiotic use decreased by 37.82 DOT/1000 patient-days (p=0.002) between pre-intervention and intervention periods, driven by a reduction in the use of third-generation cephalosporins (−29.59 DOT/1000 patient-days, p<0.001), carbapenems (−22.32 DOT/1000 patient-days, p<0.001), and piperacillin-tazobactam (−11.01 DOT/1000 patient-days, p<0.001); in contrast, the mean use of fluoroquinolones increased (23.22 DOT/1000 patient-days, p<0.001). There was no significant change in fourth-generation cephalosporin or aminoglycoside use between periods.
Monthly antibiotic use expressed as DOT/1000 patient-days. DOT, days of therapy; BLA, beta-lactam antibiotics: meropenem, imipenem, ceftriaxone, ceftazidime, cefepime, piperacillin-tazobactam; BLSA, beta-lactam-sparing antibiotics: amikacin, gentamicin, ciprofloxacin, levofloxacin, moxifloxacin. Linear trends were fitted to the data for each group and period.
Monthly antibiotic use expressed as DOT/1000 patient-days (95% CI); results of interrupted time series analysis.
| Pre-intervention coefficient | Pre-intervention slope | p | Change in level | p | Slope change | p | Intervention slope | p | |
|---|---|---|---|---|---|---|---|---|---|
| Overall antibiotics | 336.65 (299.24, 374.06) | −0.47 (−5.56, 4.62) | 0.85 | −48.49 (−98.30, 1.32) | 0.06 | 2.98 (−4.24, 10.20) | 0.40 | 2.51 (−2.56, 7.59) | 0.31 |
| BLA | 273.60 (242.96, 304.24) | −0.48 (−4.65, 3.70) | 0.81 | −43.04 (−84.13, −1.95) | 0.04 | −3.19 (−9.09, 2.71) | 0.27 | −3.67 (−7.83, 0.49) | 0.08 |
| Carbapenems | 52.16 (29.33, 74.98) | −0.18 (−3.23, 2.87) | 0.90 | −15.74 (−43.96, 12.47) | 0.26 | −0.78 (−5.28, 3.72) | 0.72 | −0.96 (−4.01, 2.09) | 0.52 |
| 3rd-gen. cephalosporins | 141.65 (128.86, 154.44) | −0.78 (−2.54, 0.97) | 0.36 | −5.84 (−23.54, 11.87) | 0.50 | −2.75 (−5.16, −0.34) | 0.03 | −3.54 (−5.29, 1.78) | <0.001 |
| 4th-gen. cephalosporins | 62.57 (48.28, 76.87) | 1.35 (−0.61, 3.31) | 0.17 | −17.65 (−37.36, 2.05) | 0.08 | −0.31 (−3.02, 2.40) | 0.81 | 1.04 (−0.92, 3.01) | 0.28 |
| Pip-taz | 16.18 (9.38, 22.98) | −0.74 (−1.66, 0.18) | 0.11 | −4.56 (−13.51, 4.40) | 0.30 | 0.47 (−0.84, 1.79) | 0.46 | −0.26 (−1.18, 0.66) | 0.56 |
| BLSA | 64.09 (52.30, 75.88) | −0.17 (−2.09, 1.44) | 0.83 | −2.97 (−19.05, 13.11) | 0.70 | 6.17 (3.94, 8.40) | <0.001 | 5.99 (4.38, 5.10) | <0.001 |
| Aminoglycosides | 15.18 (9.38, 22.98) | 1.95 (0.87, 3.03) | <0.001 | −26.31 (−37.12, −15.51) | <0.001 | 1.54 (0.03, 3.05) | 0.05 | 3.49 (2.40, 4.58) | <0.001 |
| Fluoroquinolones | 48.72 (38.92, 58.52) | −2.09 (−3.43, −0.75) | <0.001 | 22.84 (9.50, 36.18) | <0.001 | 4.64 (2.78, 6.50) | <0.001 | 2.55 (1.21, 3.89) | <0.001 |
DOT, days of therapy; BLA, beta-lactam antibiotics; BLSA, beta-lactam-sparing antibiotics.
Carbapenems: meropenem, imipenem. 3rd-gen. cephalosporins: ceftriaxone, ceftazidime. 4th-gen. cephalosporins: cefepime.
Pip-taz: Piperacillin-tazobactam. Aminoglycosides: amikacin, gentamicin. Fluoroquinolones: ciprofloxacin, levofloxacin, moxifloxacin.
Comparison of mean monthly antibiotic use, expressed as DOT/1000 patient-days, in the pre-intervention and intervention periods.
| Pre-intervention period mean (SD) | Intervention period mean (SD) | Percentage mean change (%) | p | |
|---|---|---|---|---|
| Overall antibiotics | 333.69 (±27.29) | 295.87 (±25.60) | −11.33 | 0.002 |
| BLA | 270.65 (±20.12) | 204.12 (±25.02) | −24.58 | <0.001 |
| Carbapenems | 51.28 (±13.72) | 28.97 (±11.90) | −43.51 | <0.001 |
| 3rd-gen. cephalosporins | 136.18 (±13.02) | 106.59 (±17.23) | −21.73 | <0.001 |
| 4th-gen. cephalosporins | 71.64 (±12.77) | 68.02 (±12.36) | −5.05 | 0.489 |
| Pip-taz | 11.55 (±6.83) | 0.54 (±1.42) | −95.32 | <0.001 |
| BLSA | 63.04 (±12.57) | 91.75 (±24.57) | 45.54 | 0.002 |
| Aminoglycosides | 27.88 (±9.86) | 33.38 (±14.05) | 19.73 | 0.279 |
| Fluoroquinolones | 35.16 (±12.79) | 58.38 (±11.34) | 66.04 | <0.001 |
DOT, days of therapy; BLA, beta-lactam antibiotics; BLSA, beta-lactam- sparing antibiotics.
Carbapenems: meropenem, imipenem. 3rd-gen. cephalosporins: ceftriaxone, ceftazidime. 4th-gen. cephalosporins: cefepime.
Pip-taz: Piperacillin-tazobactam. Aminoglycosides: amikacin, gentamicin. Fluoroquinolones: ciprofloxacin, levofloxacin, moxifloxacin.
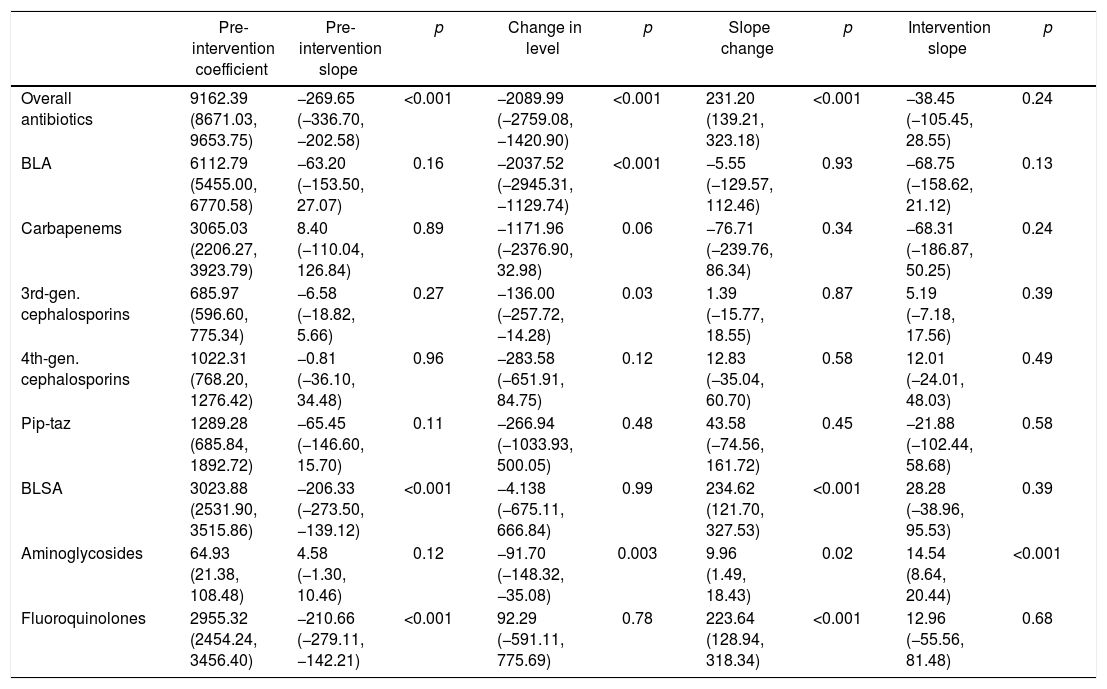
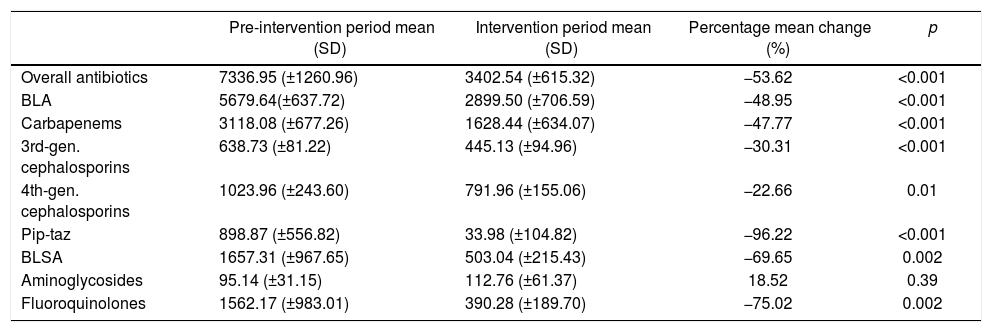
Baseline antibiotic expenditure in the first month of the study was $9162.39 (Fig. 2) and had already started to decline by $269.65 (p<0.001) per month during the pre-intervention period (Table 3). After the intervention, antibiotic costs decreased sharply, by $2089.99 (p<0.001), followed by a trend toward stabilization (slope change, $231.20, p<0.001). The mean monthly overall antibiotic expenditure decreased by 53.62% during the intervention period ($7336.95 vs. $3402.54, p<0.001); this was particularly influenced by a decline in spending on carbapenems ($3118.08 vs. $1628.44, p<0.001) and fluoroquinolones ($1562.17 vs. $390.28, p=0.002) (Table 4). A significant decrease in expenditure was observed for all classes of antibiotics, with the exception of aminoglycosides.
Monthly antibiotic expenditure in USD (95% CI); results of interrupted time series analysis.
| Pre-intervention coefficient | Pre-intervention slope | p | Change in level | p | Slope change | p | Intervention slope | p | |
|---|---|---|---|---|---|---|---|---|---|
| Overall antibiotics | 9162.39 (8671.03, 9653.75) | −269.65 (−336.70, −202.58) | <0.001 | −2089.99 (−2759.08, −1420.90) | <0.001 | 231.20 (139.21, 323.18) | <0.001 | −38.45 (−105.45, 28.55) | 0.24 |
| BLA | 6112.79 (5455.00, 6770.58) | −63.20 (−153.50, 27.07) | 0.16 | −2037.52 (−2945.31, −1129.74) | <0.001 | −5.55 (−129.57, 112.46) | 0.93 | −68.75 (−158.62, 21.12) | 0.13 |
| Carbapenems | 3065.03 (2206.27, 3923.79) | 8.40 (−110.04, 126.84) | 0.89 | −1171.96 (−2376.90, 32.98) | 0.06 | −76.71 (−239.76, 86.34) | 0.34 | −68.31 (−186.87, 50.25) | 0.24 |
| 3rd-gen. cephalosporins | 685.97 (596.60, 775.34) | −6.58 (−18.82, 5.66) | 0.27 | −136.00 (−257.72, −14.28) | 0.03 | 1.39 (−15.77, 18.55) | 0.87 | 5.19 (−7.18, 17.56) | 0.39 |
| 4th-gen. cephalosporins | 1022.31 (768.20, 1276.42) | −0.81 (−36.10, 34.48) | 0.96 | −283.58 (−651.91, 84.75) | 0.12 | 12.83 (−35.04, 60.70) | 0.58 | 12.01 (−24.01, 48.03) | 0.49 |
| Pip-taz | 1289.28 (685.84, 1892.72) | −65.45 (−146.60, 15.70) | 0.11 | −266.94 (−1033.93, 500.05) | 0.48 | 43.58 (−74.56, 161.72) | 0.45 | −21.88 (−102.44, 58.68) | 0.58 |
| BLSA | 3023.88 (2531.90, 3515.86) | −206.33 (−273.50, −139.12) | <0.001 | −4.138 (−675.11, 666.84) | 0.99 | 234.62 (121.70, 327.53) | <0.001 | 28.28 (−38.96, 95.53) | 0.39 |
| Aminoglycosides | 64.93 (21.38, 108.48) | 4.58 (−1.30, 10.46) | 0.12 | −91.70 (−148.32, −35.08) | 0.003 | 9.96 (1.49, 18.43) | 0.02 | 14.54 (8.64, 20.44) | <0.001 |
| Fluoroquinolones | 2955.32 (2454.24, 3456.40) | −210.66 (−279.11, −142.21) | <0.001 | 92.29 (−591.11, 775.69) | 0.78 | 223.64 (128.94, 318.34) | <0.001 | 12.96 (−55.56, 81.48) | 0.68 |
BLA, beta-lactam antibiotics; BLSA, beta-lactam-sparing antibiotics.
Carbapenems: meropenem, imipenem. 3rd-gen. cephalosporins: ceftriaxone, ceftazidime. 4th-gen. cephalosporins: cefepime.
Pip-taz: Piperacillin-tazobactam. Aminoglycosides: amikacin, gentamicin. Fluoroquinolones: ciprofloxacin, levofloxacin, moxifloxacin.
Comparison of mean monthly antibiotic expenditure (USD) between pre-intervention and intervention periods.
| Pre-intervention period mean (SD) | Intervention period mean (SD) | Percentage mean change (%) | p | |
|---|---|---|---|---|
| Overall antibiotics | 7336.95 (±1260.96) | 3402.54 (±615.32) | −53.62 | <0.001 |
| BLA | 5679.64(±637.72) | 2899.50 (±706.59) | −48.95 | <0.001 |
| Carbapenems | 3118.08 (±677.26) | 1628.44 (±634.07) | −47.77 | <0.001 |
| 3rd-gen. cephalosporins | 638.73 (±81.22) | 445.13 (±94.96) | −30.31 | <0.001 |
| 4th-gen. cephalosporins | 1023.96 (±243.60) | 791.96 (±155.06) | −22.66 | 0.01 |
| Pip-taz | 898.87 (±556.82) | 33.98 (±104.82) | −96.22 | <0.001 |
| BLSA | 1657.31 (±967.65) | 503.04 (±215.43) | −69.65 | 0.002 |
| Aminoglycosides | 95.14 (±31.15) | 112.76 (±61.37) | 18.52 | 0.39 |
| Fluoroquinolones | 1562.17 (±983.01) | 390.28 (±189.70) | −75.02 | 0.002 |
BLA, beta-lactam antibiotics; BLSA, beta-lactam-sparing antibiotics.
Carbapenems: meropenem, imipenem. 3rd-gen. cephalosporins: ceftriaxone, ceftazidime. 4th-gen. cephalosporins: cefepime.
Pip-taz: Piperacillin-tazobactam. Aminoglycosides: amikacin, gentamicin. Fluoroquinolones: ciprofloxacin, levofloxacin, moxifloxacin.
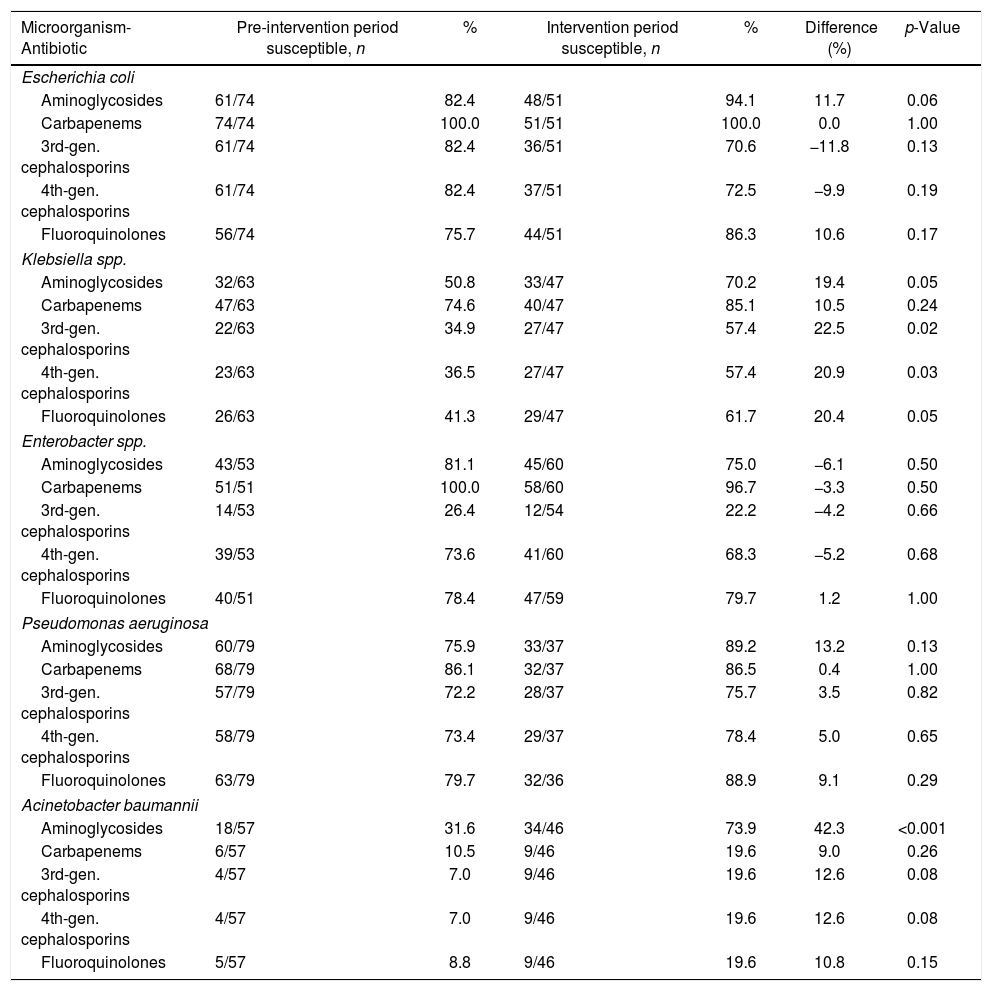
During the intervention period, we observed a significant increase in the proportion of Klebsiella spp. isolates that were susceptible to third-generation cephalosporins (22.5%, p=0.02) and fourth-generation cephalosporins (20.9%, p=0.03) (Table 5). Similarly, a significantly higher proportion of Acinetobacter baumannii isolates demonstrated susceptibility to aminoglycosides during the intervention phase (42.33%, p<0.001).
Comparison of antimicrobial susceptibility profiles for key pathogens in the pre-intervention and intervention periods, presented as proportion of susceptible organisms for each class of antibiotics.
| Microorganism-Antibiotic | Pre-intervention period susceptible, n | % | Intervention period susceptible, n | % | Difference (%) | p-Value |
|---|---|---|---|---|---|---|
| Escherichia coli | ||||||
| Aminoglycosides | 61/74 | 82.4 | 48/51 | 94.1 | 11.7 | 0.06 |
| Carbapenems | 74/74 | 100.0 | 51/51 | 100.0 | 0.0 | 1.00 |
| 3rd-gen. cephalosporins | 61/74 | 82.4 | 36/51 | 70.6 | −11.8 | 0.13 |
| 4th-gen. cephalosporins | 61/74 | 82.4 | 37/51 | 72.5 | −9.9 | 0.19 |
| Fluoroquinolones | 56/74 | 75.7 | 44/51 | 86.3 | 10.6 | 0.17 |
| Klebsiella spp. | ||||||
| Aminoglycosides | 32/63 | 50.8 | 33/47 | 70.2 | 19.4 | 0.05 |
| Carbapenems | 47/63 | 74.6 | 40/47 | 85.1 | 10.5 | 0.24 |
| 3rd-gen. cephalosporins | 22/63 | 34.9 | 27/47 | 57.4 | 22.5 | 0.02 |
| 4th-gen. cephalosporins | 23/63 | 36.5 | 27/47 | 57.4 | 20.9 | 0.03 |
| Fluoroquinolones | 26/63 | 41.3 | 29/47 | 61.7 | 20.4 | 0.05 |
| Enterobacter spp. | ||||||
| Aminoglycosides | 43/53 | 81.1 | 45/60 | 75.0 | −6.1 | 0.50 |
| Carbapenems | 51/51 | 100.0 | 58/60 | 96.7 | −3.3 | 0.50 |
| 3rd-gen. cephalosporins | 14/53 | 26.4 | 12/54 | 22.2 | −4.2 | 0.66 |
| 4th-gen. cephalosporins | 39/53 | 73.6 | 41/60 | 68.3 | −5.2 | 0.68 |
| Fluoroquinolones | 40/51 | 78.4 | 47/59 | 79.7 | 1.2 | 1.00 |
| Pseudomonas aeruginosa | ||||||
| Aminoglycosides | 60/79 | 75.9 | 33/37 | 89.2 | 13.2 | 0.13 |
| Carbapenems | 68/79 | 86.1 | 32/37 | 86.5 | 0.4 | 1.00 |
| 3rd-gen. cephalosporins | 57/79 | 72.2 | 28/37 | 75.7 | 3.5 | 0.82 |
| 4th-gen. cephalosporins | 58/79 | 73.4 | 29/37 | 78.4 | 5.0 | 0.65 |
| Fluoroquinolones | 63/79 | 79.7 | 32/36 | 88.9 | 9.1 | 0.29 |
| Acinetobacter baumannii | ||||||
| Aminoglycosides | 18/57 | 31.6 | 34/46 | 73.9 | 42.3 | <0.001 |
| Carbapenems | 6/57 | 10.5 | 9/46 | 19.6 | 9.0 | 0.26 |
| 3rd-gen. cephalosporins | 4/57 | 7.0 | 9/46 | 19.6 | 12.6 | 0.08 |
| 4th-gen. cephalosporins | 4/57 | 7.0 | 9/46 | 19.6 | 12.6 | 0.08 |
| Fluoroquinolones | 5/57 | 8.8 | 9/46 | 19.6 | 10.8 | 0.15 |
This study evaluated the impact of an ASP focused on reducing the use of broad-spectrum beta-lactams in a hospital in a middle-income country. The program was associated with an 11.33% reduction in the overall antibiotic use. DOT with broad-spectrum beta-lactams decreased by an average of 24.58%, with the change observed immediately after implementation of the ASP. In contrast, use of beta-lactam-sparing antibiotics gradually increased during the intervention period, resulting in a total increase of 45.54% by the end of the 12-month intervention. Costs attributed to antibiotic use were reduced by $3934.41 per month in the intervention period (an estimated one-year saving of $47,212.92). A downward trend in monthly antibiotic expenditure was noted prior to the formal initiation of ASP, attributed to the withdrawal of intravenous ciprofloxacin from antibiotics formulary three months before the ASP was implemented (supplementary material 2). However, a more substantial drop was observed immediately after ASP implementation, which was sustained throughout the intervention period. There was an increase in fluoroquinolone use, although expenditure on fluoroquinolones decreased in the intervention period owing to the increased consumption of oral formulations. A higher proportion of drug-susceptible Klebsiella spp. and aminoglycoside-susceptible A. baumannii were isolated during the intervention period.
Prior to this study our hospital had limited experience with formal programs promoting the rational use of medicines, beyond standard antibiotic prescription protocols without audit or management. We speculated that this was the reason why baseline broad-spectrum antibiotic use was so high and believe that this provided an excellent opportunity to moderate usage. Our baseline mean monthly consumption of carbapenems was 51.28 DOT/1000 patient-days, almost double than that reported in hospitals in the US, and our use of third and fourth-generation cephalosporins was more than double.22 As observed in similar studies in high-income countries, we have demonstrated success in reducing the use of selected antibiotics and their associated costs. Our intervention resulted in an 11.3% reduction in antibiotic use and a 53% ($3934.41) reduction in associated monthly expenditure, which was sustained throughout the study period. Similarly, Campbell et al. reduced antibiotic use in a hospital surgical ward by 12% by applying a non-restrictive policy; this was accompanied by a 35–41% reduction in antibiotic costs.23 In a study by Borde et al., after an intensive education program aimed at discouraging the use of quinolones and cephalosporins, the associated observed reduction was 14.2% in the medical wards, with a saving of €135,000 annually, excluding personnel costs.24 A study by Jenkins et al., using a semi-restrictive methodology for broad-spectrum antibiotics similar to ours, demonstrated a 14.2% reduction in total antibiotic use and a 30% reduction in the use of broad-spectrum agents; this impact was observed shortly after the start of the program and was associated with a 27.9% decrease in antibiotic expenditure.25
In a systematic review and meta-analysis, Karanika et al. evaluated the economic outcomes of 26 studies and revealed a 19.1% reduction in total antibiotic consumption and 26.6% reduction in the use of restricted antibiotics,26 similar to our reduction of 24.6%. Although there is an absolute need to reduce antibiotic consumption in BRICS countries, so far only a small number of studies have been published on this topic from low to middle-income countries. For example, in a study conducted in a cardiology hospital in Brazil, Magedanz et al. demonstrated a 25% and 69% reduction in antibiotic consumption and cost, respectively; this study attributed the success to collaboration between the clinical pharmacist and infectious diseases specialist and to the use of a non-restrictive policy.27 We observed that the use of restricted antibiotics in our study fell immediately after implementation of the ASP and that this reduction was maintained throughout the intervention period. This change was consistent with those generally observed in studies that adopt semi-restrictive policies,28,29 where the restriction results in an abrupt reduction in consumption, and auditing and feedback allow this level of use to be sustained over time.
The success of ASPs appears to be primarily related to the baseline level of consumption, in other words, the opportunity for reduction. Furthermore, the antibiotics targeted are an additional factor associated in the success of ASPs. Even small reductions in the consumption of last-resort and broad-spectrum antibiotics have an impact on the financial outcome.
There were no significant changes in the proportion of susceptibility of E. coli, Enterobacter spp., and Pseudomonas aeruginosa. We also expected an improvement in susceptibility to beta-lactams in the majority of bacteria strains, especially for carbapenems, for which reduction between periods was the greatest. Despite a dramatic increase in the consumption of fluoroquinolones, we did not see any worsening in the resistance profile of E. coli and K. pneumoniae, which has been reported in some studies.30,31 It is difficult to relate these results only to the control of antimicrobials, and there is huge variation between study models, consumption of different drugs, and follow-up time. Therefore, it is unclear how the ASP implementation impacts bacterial susceptibility profiles.13,16,25,32 Another potential source of bias related to the change is the method for laboratory identification of bacteria, which was previously performed manually by means of culture and disk-diffusion antibiograms, whereas in the intervention period, by automated methods. The susceptibility profile of Acinetobacter spp. to aminoglycosides increased from 31% to 73% with implementation of the ASP. This finding has not been reported elsewhere in the literature, but we proposed the following hypothesis. The carbapenem-resistant Acinetobacter spp. in our hospital is endemic and associated with OXA-23 carbapenemase.33 Resistance to aminoglycosides can be mediated by methylases, other aminoglycoside-modifying enzymes, and efflux pumps. The main pump associates with amikacin resistance is the adeABC.34 The adeABC gene is overexpressed by carbapenem.35 Thus, with a decreased use of carbapenem, it is possible that adeABC gene is not overexpressed and susceptibility to amikacin is therefore increased.
Although the safety of aminoglycosides has been discussed widely in the literature from the perspective of nephrotoxicity, the exchange of beta-lactams for this class was initially encouraged by the favorable susceptibility profiles of Gram-negative bacteria to amikacin and gentamicin. Furthermore, previous studies have corroborated the safety of these drugs when used in adjusted doses and with serum monitoring.36,37 In addition, a new meta-analysis highlighted the association of acute renal injury with patients receiving concomitant piperacillin-tazobactam and vancomycin, which reinforced our exchange strategy.38
This study has some limitations. First, the collection of retrospective data limits the discussion of results, especially in the case of actions performed in the pre-intervention period. Second, the ecological study design allowed us to hypothesize on ASP outcomes; however, we cannot say that the actions of the program were the only driver of results. This is especially relevant regarding bacterial susceptibility profiles, which are already known to be affected by numerous factors other than the level of antibiotic use.39 Nonetheless, we used the ITS model, which is considered a powerful tool in observational studies addressing longitudinal analyses of systemic interventions, primarily in the field of medication consumption and costs.20 The most recent review in the Cochrane Library concerning outcomes from the optimization of antibiotic prescribing included 138 studies with an ITS design, highlighting the importance of this model in the production and compilation of similar reports.
ConclusionsIn summary, a semi-restrictive ASP based on sparing extended-spectrum beta-lactams was an effective strategy for reducing targeted antibiotic consumption in a hospital setting and maintaining susceptibility profiles in Gram-negative bacteria. This study also fits with the global efforts to reduce inappropriate prescription of last-resort antibiotics, mainly in middle-income countries, and demonstrated a cost-saving strategy that was achievable with a small, specialized team.
FundingThis research did not receive any specific grants from funding agencies in the public, commercial, or not-for-profit sectors.
Conflicts of interestThe authors declare no conflicts of interest.
Authors contributionsTiago Zequinao, Pharm – wrote manuscripts and statistical analysis.
Juliano Gasparetto – revised the manuscript and database evaluation.
Dayana dos Santos Oliveira – database evaluation and revised the manuscript.
Gabriel Takahara Silva – data evaluation.
João Paulo Telles - database evaluation and revised the manuscript.
Felipe Francisco Tuon – wrote and revised the manuscript.


