Several studies show that the prevalence of multidrug-resistant HIV-1 virus is declining over time. A retrospective cohort study was carried out to evaluate the trends of drug resistance in antiretroviral treatment-exposed individuals in a state of a middle-income country, Minas Gerais, southeast region of Brazil. We analyzed 2115 HIV-1 sequences from 2002 up to 2012, from 52 cities of Minas Gerais. The groups were analyzed according to the definitions: “IAS – 3 class mutations”, if ≥1 drug resistance mutation from IAS 2015 list (DRM) was present in each class; “No fully susceptible drugs” as the absence of any fully susceptible drug in Stanford algorithm; and “GSS≥2″, when a maximum calculated GSS (genotypic susceptibility score) was ≥2 or ≥3, counting only drugs available in Brazil and USA at given calendar years. Time trends of resistance were analyzed by Cochran–Armitage test. We observed a decrease in the rate resistance mutations for PI, NRTI, “IAS – 3 class mutations”, and “No fully susceptible drugs” over these 11 years, from 69.2% to 20.7%, 92.3% to 90.2%, 46.2% to 22.5%, and 12.8% to 5.7%, respectively (p<0.05). Resistance to NNRTI increased from 74.4% to 81.6%, mainly because of K103N mutation. The GSS score ≥2 increased during the years from 35.9% to 87.3% (p<0.001). We demonstrate that resistance to PI and to the three main classes simultaneously are declining, although the number of patients on of antiretroviral therapy has doubled in the last ten years in Brazil (125,000 in 2002 to 400,000 in 2014). Broader resistance testing and the availability of more therapeutic options might have influenced this decline. The increase in NNRTI resistance can limit this class as first line treatment in Brazil in the future.
In the last 30 years HIV infection has been a leading cause of infectious diseases and death globally. Since antiretroviral treatment (ART) became available, drastic changes occurred in the management of HIV-infected patients. More than 11 million people were on treatment by the end of 2013 with subsequent improvement in patients quality of life and survival.1 However, this increase in use of ART also increased acquired and transmitted drug resistance (TDR). The prevalence of acquired HIV-1 drug resistance (ADR) in high-income countries from Europe and North America, where ART has been widely available, is declining over time.2–5 De Luca et al. showed that in Western Europe countries, three-class drug resistance increased from 0% in 1997 to a peak of 3.0% in 2005, and declined to 2% in 2008.6 Another study from Portugal showed a decrease in the prevalence of multidrug resistance over the last decade, from 6.9% in 2001–2003 to 0.6% in 2009–2012.3 However, when analyzing NNRTI class, the majority of the studies showed an increase in drug resistance.6–8 There are many studies of ADR from middle-income and resource-limited countries; however, longitudinal systematic data are scarce.9 Considering this scenario, the aim of this study was to analyze the trend and identify the predictors of acquired HIV resistance in the state of Minas Gerais, southeast region of Brazil. Minas Gerais is a large state with 20.6 million inhabitants and more than 42,000 cases of Aids up to 2015. Since 1996, the Brazilian federal government provides HIV treatment free-of-charge to more than 400,000 patients and a rational use of resources is important to ensure the program's sustainability. Moreover, the emergence of viral resistance during HIV-1 infection may jeopardize the Brazilian policy for first line and salvage regimens currently proposed. Thus, in order to assess drug resistance profiles and improve antiretroviral strategies the surveillance of acquired drug resistance is substantial. This study covers a wide period, from the moment that resistance testing became routine in clinical practice in our country in 2002–2012, and can provide valuable information about predictors of acquired drug resistance in the state of Minas Gerais.
Material and methodsAll HIV-1 genotyping tests of the public health system of Minas Gerais state are performed in our laboratory, Laboratório de Imunologia e Biologia Molecular DIP at the School of Medicine of UFMG. We consulted our laboratory database that covers 83 clinics located over 52 cities in the main macro regions of the state of Minas Gerais. Resistance data were retrieved for 2115 (69.4% of all performed tests) HIV-1-infected individuals (adults and children), who had undergone at least one drug resistance testing from January 2002 up to December 2012. The genetic data resulted from population sequencing using an automated sequencer (ABI Prism 3100, Applied Biosystems) plus a commercially available assay (ViroSeq HIV-1 Genotyping System, v2.0, Abbott) in 2002 to the first half of 2008 and Trugene HIV-1 genotyping assay (Siemens Diagnostics) from 2008 onwards.10 For each sequence, the corresponding patient demographics, the last available HIV viral load, and CD4+ T-cell counts (CD4), plus information on ART history, were matched. Viral subtype was determined by the REGA subtyping Tool version 3.0.11,12 We used the Stanford HIVdb algorithm, Version 7.0 on 2014 Feb 27, that scores drugs as susceptible, potential low level of resistance, low level of resistance, intermediate resistance, and high level of resistance. The predicted drug activity was scored as 1, 0.75, 0.5, 0.25, and 0, respectively. Enfuvirtide and raltegravir scored 0 if used prior or during the genotyping test and 1 if they were never used. Maraviroc, rilpivirine and emtricitabine were not considered, because they were not available in Brazil until December 2012. The obtained Stanford scores could then be compared with the results of a cohort study involving seven countries in Western Europe.6 They also used the Rega subtyping tool. The local Ethics Committee approved the project.
The mutations analyzed were those included in the 2013 IAS-USA list for nucleoside/tide reverse transcriptase inhibitors (NRTI), nonnucleoside reverse transcriptase inhibitors (NNRTI), and major resistance mutations to the protease inhibitors (PIs).13 The mutations were analyzed according to the definitions6: “IAS – 3 class mutations” as at least one DRM present in each class; “No fully susceptible drugs” as the absence of any fully susceptible drug in Stanford algorithm, and “GSS≥2″, when a maximum calculated GSS (genotypic susceptibility score) was ≥2, counting only drugs that were commercially available in Brazil at given calendar years. GSS calculation was done considering all possible combinations of: NRTI±NRTI±NNRTI±PI/r±T20±RAL. For this calculation, at most one agent per drug class was allowed within a combination, with the exception of NRTIs, in which unlimited combinations were allowed, except for stavudine+zidovudine and emtricitabine+lamivudine.6 This method of calculating GSS and of assigning weights according to Stanford algorithm were followed the way proposed by De Luca et al., so that the results of this study could be compared to the European study, one of the biggest published dataset.6 The data were analyzed using SPSS v.15 (SPSS Inc, Chicago, IL). Logistic regression analysis was used to assess the independent association of the variables across time.
ResultsThe baseline demographic characteristics of participants in the cohort are shown in Table 1. The 2115 sequences were obtained from 1,887 HIV-1-infected individuals in treatment failure. Median age of patients at the time of genotyping was 40.5 years (p25–p75 33.4–47.6). Overall, male to female ratio was 1.6 (1311/804). Almost 11% of the patients had more than one genotyping test performed. Median HIV-RNA viral load was 4.3logcopies/mL (p25–p75 3.9–4.7) and median CD4 count was 226cells/μL (p25–p75 84–368cells/μL). The median number of previous treatments experienced by enrolled subjects was 3 (p25–p75 2–3). The use of mono or dual therapy was 1.9% and 30.7%, respectively, and 63.3% patients used unboosted PI. Non-B subtypes were detected in 30.8% of the subjects included in the study and the second most prevalent subtype was F. All sequences belonged to patients with a history of exposure to NRTI, 72.3% to NNRTI, 51% to boosted PI, and 3.5% to novel drug class (entry inhibitors and integrase inhibitors). Use of any PI, NNRTI, DRV, ETR, T20, and RAL in the last regimen was present in 59.9%, 36.3%, 1.1%, 0.1%, 1.6%, and 0.9% of the patients, respectively. Over the years, there was an increase of patient age, of females, use of NNRTI, non-B subtypes, and a decrease of viral load at the time of genotyping. CD4 counts were stable.
Baseline demographic, immunovirological and ART history features of patients in therapeutic failure in Minas Gerais, Brazil: 2002–2012.
| Characteristic | Percent (%)b | pb | |||||||||||
|---|---|---|---|---|---|---|---|---|---|---|---|---|---|
| All years | 2002 | 2003 | 2004 | 2005 | 2006 | 2007 | 2008 | 2009 | 2010 | 2011 | 2012 | ||
| Analyzed sequences (N) | 2115 | 39 | 77 | 171 | 183 | 279 | 120 | 291 | 284 | 252 | 175 | 244 | |
| Age (years)c | 40.5 (33.4–47.6)a | 35.6 | 38.6 | 38.3 | 40.4 | 39.6 | 36.9 | 39.6 | 42.6 | 42.5 | 41.3 | 43.2 | <0.001 |
| Sex male (N. %) | 1311 (62.0) | 74.4 | 75.3 | 69.0 | 65.0 | 63.8 | 60.8 | 63.2 | 57.4 | 56.3 | 59.4 | 58.6 | <0.001 |
| Number of ART regimens before genotyping | 3 (2–4)a | 3.0 | 3.0 | 2.0 | 3.0 | 3.0 | 3.0 | 3.0 | 3.0 | 3.0 | 3.0 | 2.0 | 0.055 |
| Prior use of monotherapy with zidovudine (N. %) | 40 (1.9) | 5.1 | 7.8 | 5.8 | 1.6 | 4.3 | 5.0 | 0.3 | 0.0 | 0.0 | 0.0 | 0.0 | <0.001 |
| Prior use of dual therapy (N. %) | 650 (30.7) | 51.3 | 57.1 | 42.1 | 42.6 | 39.4 | 24.2 | 27.5 | 28.2 | 21.0 | 25.1 | 16.4 | <0.001 |
| Use of unboosted PI-based therapy (N. %) | 1339 (63.3) | 82.1 | 84.4 | 73.7 | 73.2 | 71.0 | 71.7 | 65.3 | 60.9 | 57.5 | 56.0 | 37.7 | <0.001 |
| Use of boosted PI-based therapy (N. %) | 1079 (51.0) | 38.5 | 36.4 | 36.3 | 41.5 | 39.4 | 45.0 | 59.5 | 59.2 | 58.7 | 55.4 | 60.7 | <0.001 |
| Prior use of NNRT (N. %) | 1528 (72.3) | 56.4 | 49.4 | 62.0 | 65.0 | 59.9 | 69.2 | 81.1 | 77.1 | 79.0 | 78.3 | 82.8 | <0.001 |
| Prior use of T20 (N. %) | 48 (2.3) | 0.0 | 0.0 | 0.0 | 0.0 | 0.4 | 0.8 | 7.9 | 2.5 | 4.0 | 1.7 | 1.2 | <0.001 |
| Prior use of RAL (N. %) | 24 (1.1) | 0.0 | 0.0 | 0.0 | 0.0 | 0.0 | 0.0 | 2.7 | 1.1 | 2.0 | 1.1 | 2.5 | 0.014 |
| Prior use of ETR (N. %) | 2 (0.1) | 0.0 | 0.0 | 0.0 | 0.0 | 0.0 | 0.0 | 0.0 | 0.0 | 0.8 | 0.0 | 0.0 | 0.140 |
| Baseline CD4+ T-cell count (cells/μL)c | 226.0 (84–368)a | 235.0 | 196.0 | 220.0 | 196.0 | 218.0 | 259.5 | 268.0 | 218.5 | 210.5 | 239.0 | 210.0 | 0.062 |
| Baseline HIV-1 plasma viral loadc (log10 copies/mL) | 4.3 (3.9–4.7)a | 4.7 | 4.5 | 4.4 | 4.4 | 4.3 | 4.4 | 4.2 | 4.2 | 4.1 | 4.0 | 3.9 | <0.001 |
| Subtype (N.%) | |||||||||||||
| B | 1294 (61.2) | 64.1 | 70.1 | 67.8 | 71.6 | 62.7 | 63.3 | 55.0 | 62.0 | 57.9 | 57.1 | 55.3 | <0.001 |
| F | 463 (21.9) | 17.9 | 20.8 | 22.8 | 19.1 | 24.4 | 20.8 | 24.1 | 18.3 | 19.4 | 24.6 | 24.2 | 0.647 |
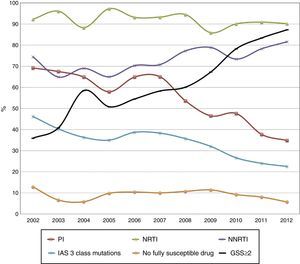
Fig. 1 shows the DRMs trends over time to different drug class: NRTI associated DRMs have decreased slightly from 92.3% to 90.2%. PI mutations were found at 69.2% of patients in 2002 and at 34.8% in 2012. NNRTI mutations are increasing, 74.4% in 2002 to 81.6% in 2012. “IAS – 3 class mutations” were 46.4% and decreased to 22.5% in 2012.
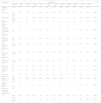
The thymidine analog mutations (TAM): M41L, D67N, K70R, L210W, T215YF, and K219EQ dropped from 56.4%, 41%, 20.5%, 41%, 69.2%, 17.2% to 27.9%, 19.3%, 14.8%, 15.6%, 38.5%, and 16%, respectively. A significant decline was observed for both type 1 TAM (M41L, D67N, L210W, and T215Y) and type 2 TAM (K70R, T215F, and K219E/Q) profiles, ranging from 74.4% to 48.4% and from 71.8% to 47.1%, respectively. The 69-insertion complex and 151 complex disappeared along the years. The K65R and M184V mutations increased from 2.6% to 7.4% and from 69.2% to 82%, respectively. Among NNRTI DRMs, a significant decline from 20.5% to 11.9% was found in Y118IC mutation, and an increase was found to K103N mutation, from 43.6% to 48%. For the PI mutations, an increase of frequency was found for I54ML, L76V, and N88S, with a peak in the years between 2008 and 2009, subsiding subsequently. The PI mutations L90M and V82AFTLS showed a significant decrease in this period. The data are shown in Table 2. The most frequent mutations in all years for NRTI were: M184V (77.4%), M41L (43.5%), and T215Y (39.9%). For NNRTI, G190A, K103N, and V108I were present in 10.7%, 42.9%, and 11.6% of sequences, respectively. L90M (24.2%), M46I (20.5%) and V82A (21.1%) were the most common DRMs to PI.
Predictors of protease inhibitor (PI), nucleoside reverse-transcriptase inhibitor (NRTI), non-nucleoside reverse-transcriptase inhibitor (NNRTI), IAS 3 class resistance, no fully susceptible drug, and genotypic susceptibility score ≥2 in treatment failing HIV-1 infected patients. Minas Gerais, Brazil, 2002–2012.
| Multivariate analysis: odds ratio (95% confidence interval) | ||||||
|---|---|---|---|---|---|---|
| Variable (reference) | PI | NRTI | NNRTI | IAS – 3 class resistance | No fully susceptible drug | GSS≥2 |
| Year | 0.88 (0.84–0.92) | – | – | 0.92 (0.89–0.96) | – | 1.24 (1.19–1.30) |
| Gender (male) | 0.55 (0.44–0.69) | 0.61 (0.44 – 0.83) | 1.37 (1.08–1.74) | 0.79 (0.64–0.97) | – | 1.61 (1.3–1.99) |
| Age in years (>50) | ||||||
| <13 | – | 0.51 (0.23–1.13) | – | – | – | 0.53 (0.35–0.82) |
| 13–30 | – | 0.43 (0.23–0.79) | – | – | – | – |
| 31–50 | – | – | – | – | – | – |
| CD4 count/cells/μL (>500) | ||||||
| <201 | 0.5 (0.36–0.71) | 0.48 (0.26–0.9) | 1.47 (1.05–2.06) | – | – | – |
| 201–500 | – | 0.79 (0.42–1.47) | 1.23 (0.88–1.71) | – | – | – |
| VL at failure/copies/mL (>100,000) | ||||||
| <10,000 | – | 1.87 (1.14–3.09) | – | – | 0.53 (0.34–0.84) | – |
| 10,000–50,000 | – | – | – | – | 0.6 (0.39–0.91) | – |
| 50,000–100,000 | – | – | – | – | – | – |
| Number of regimens | – | – | – | – | – | 0.73 (0.54–0.99) |
| Mono ZDV | 2.51 (1.01–6.27) | – | – | 2.16 (1.08–4.29) | 2.83 (1.22–6.56) | – |
| ZDV+ddI | 1.32 (1.01–1.73) | 1.58 (1.02–2.46) | – | 1.38 (1.09–1.75) | 1.54 (1.08–2.2) | 0.52 (0.41–0.67) |
| Other dual therapy | – | – | – | – | – | 0.56 (0.39–0.82) |
| Unboosted PI | 5.63 (4.41–7.2) | 1.63 (1.16–2.29) | 0.72 (0.55–0.95) | 4.18 (3.24–5.4) | 2.47 (1.6–3.83) | 0.64 (0.49–0.83) |
| Boosted PI | 1.75 (1.33–2.31) | 0.44 (0.31–0.63) | – | 1.58 (1.24–2) | 4.4 (2.72–7.12) | 0.63 (0.49–0.81) |
| Prior use of NNRTI | 0.52 (0.4–0.68) | 0.61 (0.4–0.93) | 5.57 (4.39–7.08) | 2.59 (2.01–3.33) | 1.96 (1.33–2.9) | 0.53 (0.41–0.68) |
| Prior use of T20 | 3.92 (1.47–10.43) | – | – | 3.6 (1.79–7.2) | 3.06 (1.61–5.8) | 0.14 (0.064–0.28) |
| Prior use of RAL | 3.69 (1.05–13.01) | – | – | – | – | – |
| NRTI+NNRTI in last regimen | – | – | 5.99 (4.03–8.92) | 0.53 (0.4–0.7) | 0.44 (0.26–0.75) | – |
| Any PI in the last regimen | 3.97 (2.98–5.29) | – | – | – | – | – |
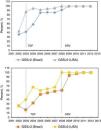
The percentage of sequences showing “No fully susceptible drugs” declined from 12.8% to 5.7%. The calculated GSS of the salvage regimen according to the available drugs in each year increased from 35.9% to 87.3%, as shown in Fig. 2.
Drug resistance profile over time. Percentage of sequences with salvage regimen with GSS≥2 (blue and gray) and GSS≥3 (yellow and orange) according to the available drugs in Brazil and USA each year (red line), p<0.001 for all GSS trends. Drugs available in Brazil/USA each year: 1991/1987: ZDV; 1993/1991: ddI; 1996/1995: 3TC, SQV; 1996/1996: RTV, IDV; 1997/1994: D4T; 1998/1996: NVP; 1998/1997: NFV; 1999/1998: EFV; 1999/1997: DLV; 2001/1998: ABC; 2002/2000: LPV/r; 2003/2001: TDF; –/2003: FTC; 2004/2003: ATV; 2005/2003: FPV, T20; 2008/2006: DRV; 2009/2007: RAL; 2009/2005: TPV; 2010/2008: ETR; –/2011: RPV; 2013/2007: MVC.
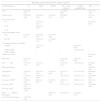
The multivariate logistic regression analysis to investigate the predictors of class resistance development on treatment is shown in Table 2. Independent predictors of PI resistance were genotyping year of study, gender, CD4 count, previous ZDV monotherapy, ZDV+ddI dual therapy, unboosted PI, boosted PI, NNRTI, T20, RAL, and any PI in the last regimen. Predictors of NRTI resistance were gender, age, CD4 count, viral load at failure, dual ZDV+ddI therapy, unboosted and boosted PI, and previous NNRTI use. NNRTI resistance was found in association with some independent predictors, including gender, CD4 count, previous unboosted PI, and NNRTI and NNRTI+NRTI use in the last regimen. Female gender was a protective factor to PI, NRTI and IAS – 3 class mutations, but not to NNRTI. The usage of unboosted rather than boosted PIs was three times more likely to be associated with evolution on PI resistance. The predictive ability of the logistic regression models used showed that mutations of resistance to NNRTI and PI were better predicted by the considered variables, as they had greater sensitivity and specificity.
DiscussionThis study describes the results of the HIV genotyped sequences of ART failing patients receiving care in the state of Minas Gerais, Brazil during 11 years. The demographic data are representative of HIV-infected patients in the whole country, with median age of 40 years and a predominance of male sex.14 An increasing in age of the failing subjects was observed across the years showing that patients attending HIV clinics are getting older due to longer survival as result of more potent and well tolerated first-line regimens. As a matter of fact the incidence of HIV infection is higher among young people in Brazil.15 Of note, the decrease in viral load at the time of genotyping could be associated to earlier detection of the therapeutic failure.16 The multivariate analysis showed an independent association of female sex with a lower rate of resistance mutations to PI, NRTI, IAS – 3 class, and a higher GSS. This finding may be explained by different adherence patterns in gender as HIV infected males in Minas Gerais state of Brazil are mainly men who have sex with men (43%). This subset of patients is historically more exposed to suboptimal therapy than the overall population.17,18 Data from a large Italian study shows a different pattern, with female gender being at a higher risk to develop resistance mutations to PI, NRTI, and NNRTI classes.4
The prevalence of F subtype is increasing over time in our state. The HIV epidemic in South America and Brazil is mainly caused by subtype B. The subtype C predominates in the south of the country and neighboring countries, reaching 44% in some cities.19–22 The subtype F predominates in Northeast of the country.23 Phylogenetic analysis is necessary to understand the dynamics of the F subtype increase in Minas Gerais.
We found that in this cohort of ART-exposed genotyped patients in a middle-income country, the PI, NRTI, and IAS – 3 class resistance is declining over time, whereas NNRTI resistance is increasing. These data were confirmed to PI, IAS – 3 class mutations, and GSS≥2 by multivariate analysis showing an independent association of calendar year with reduced probability of resistance. National data confirm this trend24 and this is in line with the National HIV Treatment Guidelines changes during these years, which encouraged the use of NRTI+NNRTI (EFV) as the first treatment option.14,25 The NNRTI resistance increase was also associated to the lower genetic barrier of this drug class. From 2002 to 2005, the most common NNRTI mutation, K103N, decreased, but started to increase after 2005 through to 2012. Our state data differ from the National data: while the of 3 class resistance rate in Minas Gerais tends to decrease, this rate remained stable countrywide.16
Data from high-income countries from Europe show similar trends to PI, NRTI, and IAS – 3 class resistance mutations.3,6,26,27 Some high-income countries also showed that the rate of NNRTI resistance tends to increase.3,6,27,28 For the PI class, this decline was of almost 50%, and it can be the reflex of the more widespread use of boosted PI.
The reduction of ADR at the moment of therapeutic failure can also be associated to the reduction of TDR,29,30 although in a German study the proportion of TDR was stable despite a significant ADR decline over time.27 The TDR in Brazil has been studied but not systematically, so there are no longitudinal data to compare TDR and ADR.17,23 A recent study has shown that there may be some association between resistance mutations that appear among patients failing therapy (ADR) and TDR in patients with a recent infection, suggesting that the ADR can also be used to monitor TDR.16
The main limitation of this study is its retrospective design, based on the sample of a single state of Brazil. The national databanks and medical forms used to extract baseline data did not contain all requested information and missing data were common, thus limiting the size of the sample. Adherence was an important variable that could not be evaluated here.
In summary, we have demonstrated that antiretroviral resistance is declining in Minas Gerais, Brazil, although the ARV availability has more than tripled in the last 10 years in the country (125,000 in 2002 to 400,000 in 2014). Broader resistance testing might have influenced this decline, as well as resistance testing guided therapy and the availability of more therapeutic options.
Conflicts of interestThe authors declare no conflicts of interest.
The Projeto G.E.R.A. is team: Ronaldo Batista Melo Junior, Luana Assis Torres, Luisa Cinque de Melo, Isabela Vianello Valle, Ligia Iasmine Pereira dos Santos Gualberto, Júlia Teixeira Tupinambás, and Mariana Fauster Fonseca Araújo de Oliveira.


