


Use of antibiotic and bacterial resistance is the result of a complex interaction not completely understood.
ObjectivesTo evaluate the impact of entire antimicrobial use (community plus hospitals) on the incidence of bloodstream infections in intensive care units adjusted by socioeconomic factors, quality of healthcare, and access to the healthcare system.
DesignEcologic study using a hierarchical spatial model.
SettingData obtained from 309 hospitals located in the state of São Paulo, Brazil from 2008 to 2011.
ParticipantsIntensive care units located at participant hospitals.
OutcomeHospital acquired bloodstream infection caused by MDRO in ICU patients was our primary outcome and data were retrieved from São Paulo Health State Department. Socioeconomic and healthcare indexes data were obtained from IBGE (Brazilian Foundation in charge of national decennial census) and SEADE (São Paulo Planning and Development Department). Information on antimicrobial sales were obtained from IMS Brazil. We divided antibiotics into four different groups (1–4).
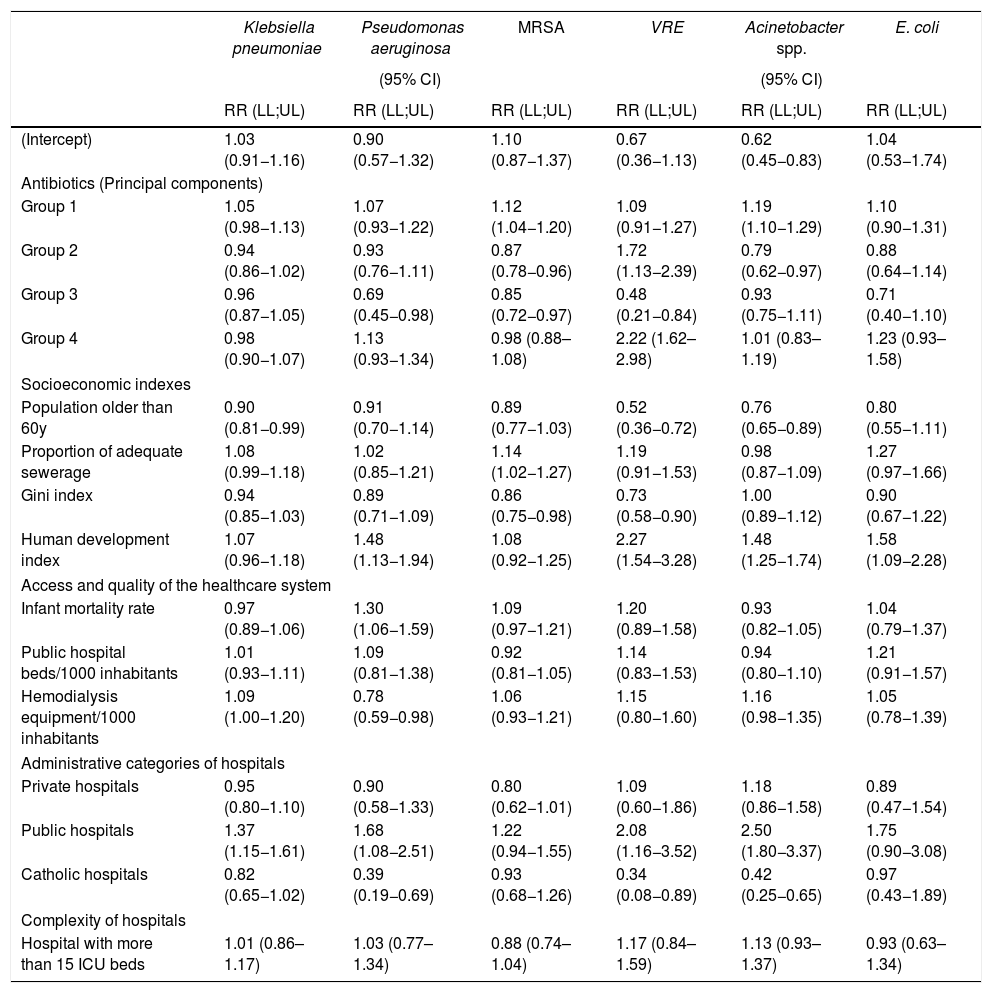
ResultsWe observed a direct association between the use of group 1 of antibiotics and the incidences of bloodstream infections caused by MRSA (1.12; 1.04–1.20), and CR-Acinetobacter sp. (1.19; 1.10–1.29). Groups 2 and 4 were directly associated to VRE (1.72; 1.13–2.39 and 2.22; 1.62–2.98, respectively). Group 2 was inversely associated to MRSA (0.87; 0.78–0.96) and CR-Acinetobacter sp. (0.79; 0.62–0.97). Group 3 was inversely associated to Pseudomonas aeruginosa (0.69; 0.45–0.98), MRSA (0.85; 0.72–0.97) and VRE (0.48; 0.21–0.84). No association was observed for third generation cephalosporin-resistant Klebsiella pneumoniae and Escherichia coli.
ConclusionsThe association between entire antibiotic use and resistance in ICU was poor and not consistent for all combinations of antimicrobial groups and pathogens even after adjusted by socioeconomic indexes. Selective pressure exerted at the community level seemed not to affect the incidences of MDRO infection observed in intensive care setting.
The use of antibiotics has been considered an important driver of bacterial resistance since they were introduced to modern medicine.1 Given that these drugs are necessary for human and animal care as well as to ensure food safety, their use must meet best practices of consumption and be treated as a common good. Bacterial infections due to resistant microorganisms, like other infectious diseases, have been demonstrated to be associated with socioeconomic status, access and quality of healthcare.2 Furthermore, the burden of bacterial resistance is different in different areas of the globe.3 In this sense, understanding the determinants of bacterial resistance in a given area is important to support public policies leading to more efficient control of its spread.
The World Health Organization as well as Infectious Diseases Societies have proposed that governments coordinate actions to minimize and limit the spread of antimicrobial resistance.4,5 In Brazil, a law restricting over-the-counter sales of antibiotics was passed by the federal government in 2010, which had a variable impact on sales in different geographic areas of the country.6 Another study, investigating socioeconomic determinants of antibiotic use in the state of São Paulo, Brazil, found an association between higher consumption of antimicrobial drugs and markers of social inclusion such as higher human development index, density of private health establishments, and lower illiteracy.7 To date, no studies were published investigating the impact of this Brazilian law on the occurrence of multidrug resistant organisms (MDRO) either in the community or in the healthcare setting.
In this study we explored the impact of overall antibiotic use, i.e. the sum of what is consumed at the community and in hospitals, on the incidence of infections caused by MDRO within intensive care units in the same area and adjusted for socioeconomic indexes, quality and access to healthcare.
ObjectiveThe aim of this study was to evaluate the impact of overall antimicrobial use (community plus hospitals) on the incidence of bloodstream infections at intensive care units adjusted by socioeconomic factors, quality of healthcare, and access to the healthcare system.
MethodsStudy design, geographic area and study populationAn ecologic study aggregating data from 309 hospitals located in the state of São Paulo, Brazil from 2008 to 2011 (Fig. 1) was designed. São Paulo is the wealthiest state of the Brazilian Federation, located in the southeastern of the Country, with approximately 41 million inhabitants and a human development index of 0.78 in 2010 (www.ibge.gov.br). This study was approved by the Research Ethics Committee of the University of São Paulo, protocol number 443/11 in November 9th, 2011.
Data sources. State of São Paulo, Brazil, 2008–2011. The coordinate system is Datum World Geodesic System (WGS 1984).")
- 1.
State Health Department (SHD) — the hospital infection branch of SHD established a Nosocomial Surveillance System in 2004, which included the reporting of central line-associated bloodstream infections as well as secondary bacteremia due to infections at other sites. We included 309 hospitals distributed in 105 municipalities based on their consistent data reporting during the study period (2008 through 2011).
- 2.
Instituto Brasileiro de Geografia e Estatística (IBGE) — a Brazilian Federal Foundation responsible for the national decennial census. We extracted São Paulo socioeconomic and healthcare indexes from this database as described below.
- 3.
Sistema Estadual de Análise da Dados (SEADE) — this foundation is a branch of São Paulo Planning and Development Department and is responsible for socioeconomic and demographic analyses.
- 4.
Intercontinental Medical Statistics Brazil (IMS) — this is a private company that provides information on antimicrobial sales in a given geographic area. We acquired information on antimicrobial sales in the state of São Paulo during the study period. Data on sales were considered as a proxy for antimicrobial use. Antimicrobial data are presented as daily defined doses (DDD) per 1000 inhabitants per year according to the Anatomical Chemical Classification system.8 This reflects the number of daily defined doses consumed per 1000 inhabitants in one year as follows: (quantity of antimicrobial in a given year (g) × 1000)/(DDD for that drug × population). Bloodstream infection (BSI) rates of a given year were estimated based on the antimicrobial use during the previous year as an explanatory variable.
Our primary outcome was the number of BSI caused by MDRO in ICUs reported to São Paulo SHD. The definition of BSI was a composite of the Centers for Disease Control and Prevention (Atlanta, USA) criteria for catheter-associated BSI9 and bacteremia secondary to infection at other anatomic sites. MDRO were defined as: carbapenem-resistant Acinetobacter sp. and Pseudomonas aeruginosa; Escherichia coli and Klebsiella pneumoniae resistant to third generation cephalosporins; methicillin-resistant Staphylococcus aureus (MRSA); and vancomycin-resistant Enterococcus spp. (VRE).
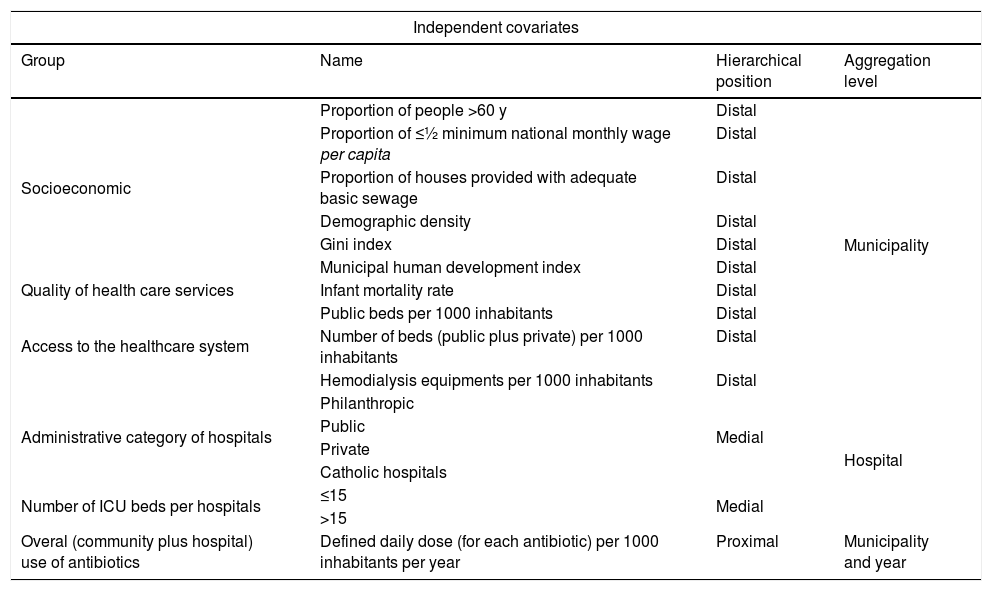
We investigated socioeconomic status, quality of healthcare, access to healthcare system and antimicrobial use (overall antibiotic use throughout the state of Sao Paulo i.e., community plus hospital use) as independent covariates associated with BSI caused by MDRO. Initially, the following indicators were evaluated (Table 1):
- a)
Socioeconomic indexes: proportion of individuals older than 60 years; proportion of homes provided with sewerage; Gini index; municipal human development index; proportion of the population with earnings of half a minimum wage per capita or less; and demographic density.
- b)
Quality of healthcare was evaluated by infant mortality rate defined by the number of deaths of children under one year of age per 1000 live births.
- c)
Access to the healthcare system was evaluated by the number of hospital beds (public + private)/1000 inhabitants; and the number of hemodialysis equipment/1000 inhabitants.
- d)
Hospital type — hospitals were divided into four administrative categories: philanthropic, private, public, and catholic hospitals (a subset of hospitals usually managed by the catholic church providing public and private care); and into two size categories: up to 15 intensive care beds; and more than 15 intensive care beds.
- e)
Overall (community + hospital) antimicrobial use: since there were 42 covariates (single compounds) representing all antibiotic consumption in the state of São Paulo, we used Principal Component Analysis (PCA) to dimensionality reduction. This procedure converts a set of possibly correlated covariates into a set of linearly non-correlated covariates. Thus, each Principal Component (PC) represents a group of antibiotics that would explain part of the variability of our primary outcome.
Hierarchical classification of independent covariates and their aggregation levels investigated as potential associated factors with bloodstream infections caused by multidrug resistant organisms in intensive care units in the state of São Paulo, Brazil, 2009–2011.
| Independent covariates | |||
|---|---|---|---|
| Group | Name | Hierarchical position | Aggregation level |
| Socioeconomic | Proportion of people >60 y | Distal | Municipality |
| Proportion of ≤½ minimum national monthly wage per capita | Distal | ||
| Proportion of houses provided with adequate basic sewage | Distal | ||
| Demographic density | Distal | ||
| Gini index | Distal | ||
| Municipal human development index | Distal | ||
| Quality of health care services | Infant mortality rate | Distal | |
| Access to the healthcare system | Public beds per 1000 inhabitants | Distal | |
| Number of beds (public plus private) per 1000 inhabitants | Distal | ||
| Hemodialysis equipments per 1000 inhabitants | Distal | ||
| Administrative category of hospitals | Philanthropic | Medial | Hospital |
| Public | |||
| Private | |||
| Catholic hospitals | |||
| Number of ICU beds per hospitals | ≤15 | Medial | |
| >15 | |||
| Overal (community plus hospital) use of antibiotics | Defined daily dose (for each antibiotic) per 1000 inhabitants per year | Proximal | Municipality and year |
We used hierarchical models assuming that some factors have a direct impact on the outcome and others are mediated through other factors. In this study socioeconomic indexes, access to the healthcare system and quality of healthcare delivered were defined as distal covariates. Administrative category of hospitals and number of ICU beds as medial covariates and antimicrobial use during the year preceding the outcome as proximal covariate. Also, these covariates had different aggregation levels (Table 1). The distal and medial covariates were evaluated for collinearity using variance inflation factor (VIF), with a cut point <3.10
We built hierarchical models using the number of cases of each BSI as outcomes measured for each hospital once-a-year (2009–2011). To account for the fact that several hospitals were located in the same municipality, a municipality random effect was included; we also specified a random effect for the years. We then considered a more complex model, where in addition to the random effects described above, the spatial dependence of BSI incidence related to geographic localization of the hospitals was accounted for through a combination of unstructured and spatially structured random effect (BYM).11
A Poisson distribution was specified on the outcome. In all models, the logarithm of the expected number of cases, calculated by indirect standardization, was used as “offset” to express the cases in terms of relative risk (RR).11 Given the high proportion of zeros within MDRO BSI incidence among hospitals, varying from 34% to 85% for MRSA and VRE, respectively, we also considered a zero-inflated Poisson distribution on the outcome for the models with and without the spatial component.
The models were run using INLA (Integrated Nested Laplace Approximations) in a Bayesian context.12 We considered non-informative priors for the fixed effects and for the random effects related to the covariates “municipality” and “year. Analyses were performed using R 3.4.1 software (R Core Team, 2017) and INLA packages 0.0-1432754561 (www.r-inla.org).
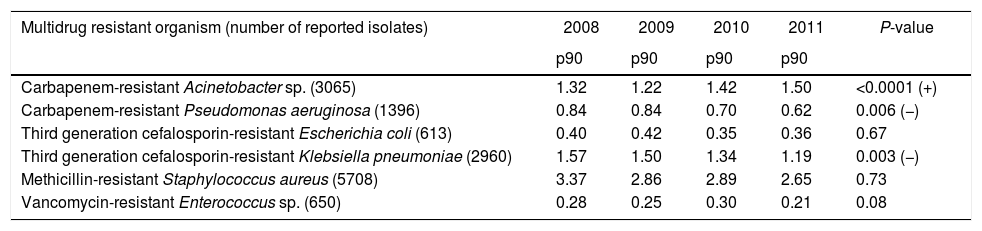
ResultsDescriptive epidemiologyThe number of hospitals per municipality categorized by number of beds is shown in Table 2. From 2008 to 2011 14,392 BSI caused by MDRO were reported to the São Paulo State Health Department (SHD). The incidence by species is listed in Table 3. During the study period, there was a significant increase in incidence of BSI caused by carbapenem-resistant Acinetobacter sp. and a decrease in incidence of BSI caused by carbapenem-resistant P. aeruginosa and by third generation cephalosporin-resistant K. pneumoniae. We observed stability in incidences of third generation cephalosporin-resistant E. coli, methicillin-resistant S. aureus (MRSA), and vancomycin-resistant Enterococcus sp. Surveillance of carbapenem-resistant Enterobacteriaceae was only started in 2011, with increasingly high incidences (data not shown) and were not analyzed in this study.
Pooled means (percentile 90) of incidence of laboratory confirmed bloodstream infection per 1000 patients in intensive care units from 309 hospitals stratified by multidrug-resistant organism. State Health Department, São Paulo, Brazil, 2008 to 2011.
| Multidrug resistant organism (number of reported isolates) | 2008 | 2009 | 2010 | 2011 | P-value |
|---|---|---|---|---|---|
| p90 | p90 | p90 | p90 | ||
| Carbapenem-resistant Acinetobacter sp. (3065) | 1.32 | 1.22 | 1.42 | 1.50 | <0.0001 (+) |
| Carbapenem-resistant Pseudomonas aeruginosa (1396) | 0.84 | 0.84 | 0.70 | 0.62 | 0.006 (−) |
| Third generation cefalosporin-resistant Escherichia coli (613) | 0.40 | 0.42 | 0.35 | 0.36 | 0.67 |
| Third generation cefalosporin-resistant Klebsiella pneumoniae (2960) | 1.57 | 1.50 | 1.34 | 1.19 | 0.003 (−) |
| Methicillin-resistant Staphylococcus aureus (5708) | 3.37 | 2.86 | 2.89 | 2.65 | 0.73 |
| Vancomycin-resistant Enterococcus sp. (650) | 0.28 | 0.25 | 0.30 | 0.21 | 0.08 |
p90: 90th percentile; + increasing incidence; − decreasing incidence.
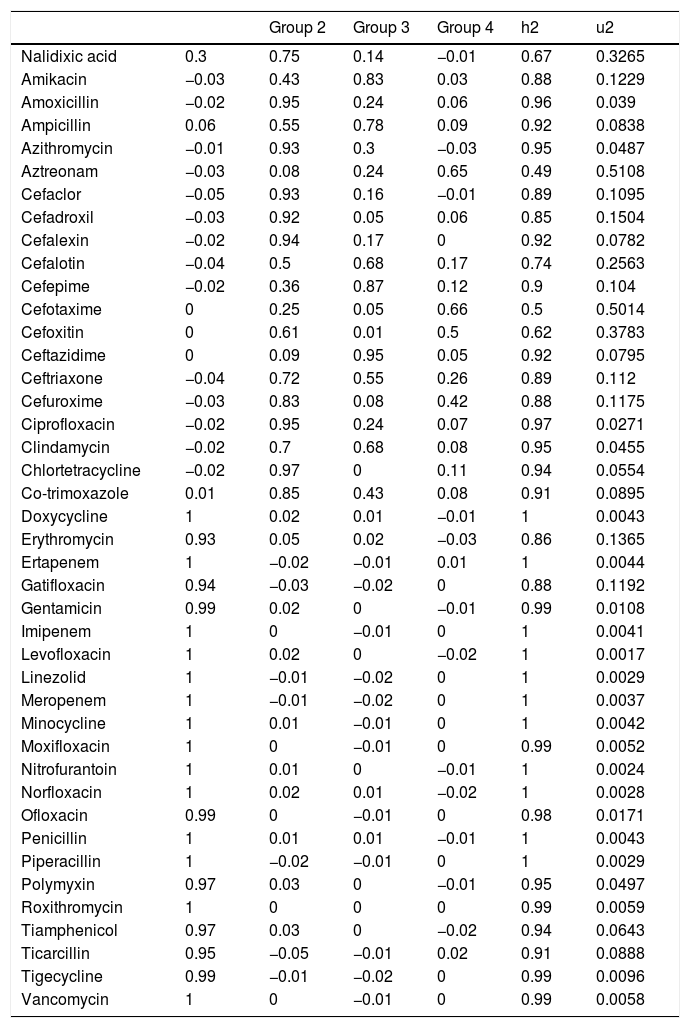
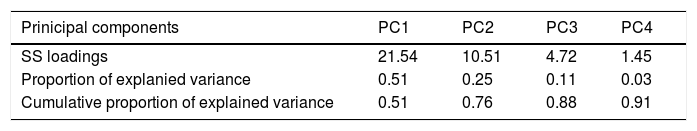
After applying the PCA, we transformed the highly correlated 42 antibiotic compounds into four linearly non-correlated covariates (Groups 1–4). Using the component varimax rotation, these four components presented eigenvalues greater than 1 and explained 91% of the whole data variability (Table 6). Based on these results, we used the four PC to identify four groups of antibiotics, so that, each PC represented a set of antibiotics that plays the role of one explanatory covariate. Thus, we used the correlation between consumption of each antibiotic and the four PC (Table 4). Each group consisted of antibiotics that presented significant correlation coefficients with the correspondent components (shaded cells in Table 4). Groups 2–4 consisted predominantly of cephalosporins and semi-synthetic penicillins and Group 1 agglutinated predominantly non-beta-lactam antibiotics. Most non-beta-lactam large spectrum antibiotics used in hospitals are represented in group 1. All the groups were associated with BSI caused by MRSA, VRE, carbapenem-resistant Acinetobacter sp. and P. aeruginosa in different directions. The higher the use of antimicrobials of group 1, the higher was the incidence of BSI caused by MRSA and Acinetobacter spp., while the higher the use of group 2 and 4, the higher was the incidence of BSI caused by VRE. On the other hand, group 2 was inversely correlated with incidence of MRSA and Acinetobacter spp. and group 3 was inversely correlated with P. aeruginosa, MRSA and VRE. No association was observed between antimicrobial use and cephalosporin-resistant K. pneumoniae and E. coli incidences.
Correlation coefficients between 42 antibiotics sold during 2008–2010 within the state of São Paulo, Brazil and the four principal components named as antimicrobial groups 1–4.
| Group 2 | Group 3 | Group 4 | h2 | u2 | ||
|---|---|---|---|---|---|---|
| Nalidixic acid | 0.3 | 0.75 | 0.14 | −0.01 | 0.67 | 0.3265 |
| Amikacin | −0.03 | 0.43 | 0.83 | 0.03 | 0.88 | 0.1229 |
| Amoxicillin | −0.02 | 0.95 | 0.24 | 0.06 | 0.96 | 0.039 |
| Ampicillin | 0.06 | 0.55 | 0.78 | 0.09 | 0.92 | 0.0838 |
| Azithromycin | −0.01 | 0.93 | 0.3 | −0.03 | 0.95 | 0.0487 |
| Aztreonam | −0.03 | 0.08 | 0.24 | 0.65 | 0.49 | 0.5108 |
| Cefaclor | −0.05 | 0.93 | 0.16 | −0.01 | 0.89 | 0.1095 |
| Cefadroxil | −0.03 | 0.92 | 0.05 | 0.06 | 0.85 | 0.1504 |
| Cefalexin | −0.02 | 0.94 | 0.17 | 0 | 0.92 | 0.0782 |
| Cefalotin | −0.04 | 0.5 | 0.68 | 0.17 | 0.74 | 0.2563 |
| Cefepime | −0.02 | 0.36 | 0.87 | 0.12 | 0.9 | 0.104 |
| Cefotaxime | 0 | 0.25 | 0.05 | 0.66 | 0.5 | 0.5014 |
| Cefoxitin | 0 | 0.61 | 0.01 | 0.5 | 0.62 | 0.3783 |
| Ceftazidime | 0 | 0.09 | 0.95 | 0.05 | 0.92 | 0.0795 |
| Ceftriaxone | −0.04 | 0.72 | 0.55 | 0.26 | 0.89 | 0.112 |
| Cefuroxime | −0.03 | 0.83 | 0.08 | 0.42 | 0.88 | 0.1175 |
| Ciprofloxacin | −0.02 | 0.95 | 0.24 | 0.07 | 0.97 | 0.0271 |
| Clindamycin | −0.02 | 0.7 | 0.68 | 0.08 | 0.95 | 0.0455 |
| Chlortetracycline | −0.02 | 0.97 | 0 | 0.11 | 0.94 | 0.0554 |
| Co-trimoxazole | 0.01 | 0.85 | 0.43 | 0.08 | 0.91 | 0.0895 |
| Doxycycline | 1 | 0.02 | 0.01 | −0.01 | 1 | 0.0043 |
| Erythromycin | 0.93 | 0.05 | 0.02 | −0.03 | 0.86 | 0.1365 |
| Ertapenem | 1 | −0.02 | −0.01 | 0.01 | 1 | 0.0044 |
| Gatifloxacin | 0.94 | −0.03 | −0.02 | 0 | 0.88 | 0.1192 |
| Gentamicin | 0.99 | 0.02 | 0 | −0.01 | 0.99 | 0.0108 |
| Imipenem | 1 | 0 | −0.01 | 0 | 1 | 0.0041 |
| Levofloxacin | 1 | 0.02 | 0 | −0.02 | 1 | 0.0017 |
| Linezolid | 1 | −0.01 | −0.02 | 0 | 1 | 0.0029 |
| Meropenem | 1 | −0.01 | −0.02 | 0 | 1 | 0.0037 |
| Minocycline | 1 | 0.01 | −0.01 | 0 | 1 | 0.0042 |
| Moxifloxacin | 1 | 0 | −0.01 | 0 | 0.99 | 0.0052 |
| Nitrofurantoin | 1 | 0.01 | 0 | −0.01 | 1 | 0.0024 |
| Norfloxacin | 1 | 0.02 | 0.01 | −0.02 | 1 | 0.0028 |
| Ofloxacin | 0.99 | 0 | −0.01 | 0 | 0.98 | 0.0171 |
| Penicillin | 1 | 0.01 | 0.01 | −0.01 | 1 | 0.0043 |
| Piperacillin | 1 | −0.02 | −0.01 | 0 | 1 | 0.0029 |
| Polymyxin | 0.97 | 0.03 | 0 | −0.01 | 0.95 | 0.0497 |
| Roxithromycin | 1 | 0 | 0 | 0 | 0.99 | 0.0059 |
| Tiamphenicol | 0.97 | 0.03 | 0 | −0.02 | 0.94 | 0.0643 |
| Ticarcillin | 0.95 | −0.05 | −0.01 | 0.02 | 0.91 | 0.0888 |
| Tigecycline | 0.99 | −0.01 | −0.02 | 0 | 0.99 | 0.0096 |
| Vancomycin | 1 | 0 | −0.01 | 0 | 0.99 | 0.0058 |
Groups 1–4 — principal component, h2 — proportion of variability explained by the individual antimicrobial; u2 — proportion of the variability not explained by the individual antimicrobial. Shaded cells represent significant correlation (>0.3) and thus, these compounds together (in each column) constitute a group that would explain part of the variability of the incidence of bloodstream infections caused by multidrug-resistant organisms in intensive care units.
First, we conducted the variance inflation factor analysis of the distal and medial covariates (Table 1) and two socioeconomic covariates were not considered in the modelling because of collinearity: demographic density and number of beds (public + private) per 1000 inhabitants.
We present the posterior mean fixed effects and 95% credible intervals (CI) for the models with the spatial component and Poisson distribution inflated with zeros for BSI caused by MDRO in ICU (Table 5). The 11 most used antimicrobials were ranked by their sales (Fig. 2).
Regression analysis for covariates predicting bloodstream infection caused by multi-drug resistant organisms in 309 intensive care units of São Paulo State, Brazil, 2008-2011.
| Klebsiella pneumoniae | Pseudomonas aeruginosa | MRSA | VRE | Acinetobacter spp. | E. coli | |
|---|---|---|---|---|---|---|
| (95% CI) | (95% CI) | |||||
| RR (LL;UL) | RR (LL;UL) | RR (LL;UL) | RR (LL;UL) | RR (LL;UL) | RR (LL;UL) | |
| (Intercept) | 1.03 (0.91−1.16) | 0.90 (0.57−1.32) | 1.10 (0.87−1.37) | 0.67 (0.36−1.13) | 0.62 (0.45−0.83) | 1.04 (0.53−1.74) |
| Antibiotics (Principal components) | ||||||
| Group 1 | 1.05 (0.98−1.13) | 1.07 (0.93−1.22) | 1.12 (1.04−1.20) | 1.09 (0.91−1.27) | 1.19 (1.10−1.29) | 1.10 (0.90−1.31) |
| Group 2 | 0.94 (0.86−1.02) | 0.93 (0.76−1.11) | 0.87 (0.78−0.96) | 1.72 (1.13−2.39) | 0.79 (0.62−0.97) | 0.88 (0.64−1.14) |
| Group 3 | 0.96 (0.87−1.05) | 0.69 (0.45−0.98) | 0.85 (0.72−0.97) | 0.48 (0.21−0.84) | 0.93 (0.75−1.11) | 0.71 (0.40−1.10) |
| Group 4 | 0.98 (0.90−1.07) | 1.13 (0.93−1.34) | 0.98 (0.88–1.08) | 2.22 (1.62–2.98) | 1.01 (0.83–1.19) | 1.23 (0.93–1.58) |
| Socioeconomic indexes | ||||||
| Population older than 60y | 0.90 (0.81−0.99) | 0.91 (0.70−1.14) | 0.89 (0.77−1.03) | 0.52 (0.36−0.72) | 0.76 (0.65−0.89) | 0.80 (0.55−1.11) |
| Proportion of adequate sewerage | 1.08 (0.99−1.18) | 1.02 (0.85−1.21) | 1.14 (1.02−1.27) | 1.19 (0.91−1.53) | 0.98 (0.87−1.09) | 1.27 (0.97−1.66) |
| Gini index | 0.94 (0.85−1.03) | 0.89 (0.71−1.09) | 0.86 (0.75−0.98) | 0.73 (0.58−0.90) | 1.00 (0.89−1.12) | 0.90 (0.67−1.22) |
| Human development index | 1.07 (0.96−1.18) | 1.48 (1.13−1.94) | 1.08 (0.92−1.25) | 2.27 (1.54−3.28) | 1.48 (1.25−1.74) | 1.58 (1.09−2.28) |
| Access and quality of the healthcare system | ||||||
| Infant mortality rate | 0.97 (0.89−1.06) | 1.30 (1.06−1.59) | 1.09 (0.97−1.21) | 1.20 (0.89−1.58) | 0.93 (0.82−1.05) | 1.04 (0.79−1.37) |
| Public hospital beds/1000 inhabitants | 1.01 (0.93−1.11) | 1.09 (0.81−1.38) | 0.92 (0.81−1.05) | 1.14 (0.83−1.53) | 0.94 (0.80−1.10) | 1.21 (0.91−1.57) |
| Hemodialysis equipment/1000 inhabitants | 1.09 (1.00−1.20) | 0.78 (0.59−0.98) | 1.06 (0.93−1.21) | 1.15 (0.80−1.60) | 1.16 (0.98−1.35) | 1.05 (0.78−1.39) |
| Administrative categories of hospitals | ||||||
| Private hospitals | 0.95 (0.80−1.10) | 0.90 (0.58−1.33) | 0.80 (0.62−1.01) | 1.09 (0.60−1.86) | 1.18 (0.86−1.58) | 0.89 (0.47−1.54) |
| Public hospitals | 1.37 (1.15−1.61) | 1.68 (1.08−2.51) | 1.22 (0.94−1.55) | 2.08 (1.16−3.52) | 2.50 (1.80−3.37) | 1.75 (0.90−3.08) |
| Catholic hospitals | 0.82 (0.65−1.02) | 0.39 (0.19−0.69) | 0.93 (0.68−1.26) | 0.34 (0.08−0.89) | 0.42 (0.25−0.65) | 0.97 (0.43−1.89) |
| Complexity of hospitals | ||||||
| Hospital with more than 15 ICU beds | 1.01 (0.86–1.17) | 1.03 (0.77–1.34) | 0.88 (0.74–1.04) | 1.17 (0.84–1.59) | 1.13 (0.93–1.37) | 0.93 (0.63–1.34) |
RR — relative risk, LL — lower limit, UL — upper limit, Groups 1–4 — principal (regression) component, ICU — intensive care unit. Shaded variables are statistically significant.
Principal component (PC) analysis considering all antibiotics sold in the state of São Paulo between 2008 and 2010. Data obtained from IMS Health Brazil.
| Prinicipal components | PC1 | PC2 | PC3 | PC4 |
|---|---|---|---|---|
| SS loadings | 21.54 | 10.51 | 4.72 | 1.45 |
| Proportion of explanied variance | 0.51 | 0.25 | 0.11 | 0.03 |
| Cumulative proportion of explained variance | 0.51 | 0.76 | 0.88 | 0.91 |
SS — sum of squares.
.")
Despite efforts of medical societies and governments, excessive prescription of antimicrobials is still frequent and contributes to expose patients to unnecessary adverse effects, increasing costs and the burden of bacterial resistance.1,13 This study aimed to explore the association between the burden of total antimicrobial use, mixing community and hospital use, and its impact on bacterial resistance at the hospital level adjusted for socioeconomic indices, access and quality of the healthcare system. Although we found an association between antimicrobial use and resistance, it was not consistent for all combinations of antimicrobial groups and pathogens.
As individual antimicrobial compounds were highly correlated, we used a statistical procedure to cluster them in four groups. This strategy aimed to reduce the mass of data on the use of antibiotics, with a minimum possible loss of information. We examined antibiotic use during the previous year in relation to our primary outcome i.e. incidence of bacteremia caused by MDRO in the intensive care unit. Whether or not a one-year gap is enough to demonstrate such association remains a matter of debate.1
Antimicrobials of group 1 were associated with MRSA and carbapenem-resistant Acinetobacter spp. interestingly, most group 1 antibiotics had broad spectrum and are predominantly for hospital use only. Broad spectrum hospital use of antimicrobials and incidence of MDRO infection and/or colonization is an association demonstrated in other ecologic studies.14,15 For all other groups, the associations were inversely proportional. Moreover, no association was observed for third generation cephalosporin-resistant E. coli and Klebsiella spp. This lack of consistent association between overall use of antibiotics and bacterial resistance in ICUs, led us to hypothesize that community and hospital environments function as two different compartments for selective pressure. Concurring to this idea, selective pressure exerted at community level seems to affect bacterial resistance at this level as already demonstrated in other ecologic studies.16 On the other hand, selective pressure exerted within hospitals would lead to a greater resistance burden in this scenario14 with interhospital spread of resistant strains as demonstrated by David et al.17 Based on our findings, community use of antimicrobials does not seem to have a direct effect on bacterial resistance in critical patients in ICUs, even when adjusted by socioeconomic indices and access and quality of healthcare.
Socioeconomic covariates were used for adjustment in this study. The hierarchical model chosen to explain the relationship of the multiple explanatory factors and the outcome requires a conceptual framework for epidemiological analysis that assumes that distal factors can affect the outcome directly or indirectly mediated by other factors (medial and/or proximal).18 In this logic, the initial model tests distal factors only. A second model tests the medial factor (properly) adjusted for the distal factor. A third model tests the proximal factor (properly) adjusted for the distal and medial factors. In our study, socioeconomic factors were classified as distal factors because, at least in theory, health indexes (medial factors) are not real confounders, rather they are partly determined by them. The same was assumed for the use of antimicrobials in relation to the distal and medial factors.
Interestingly, our findings demonstrated consistently higher incidences of most MDROs among public hospitals and lower incidences among catholic hospitals for all studied pathogens. For public hospitals, we hypothesize cross transmission having an incremental impact on the burden of resistance. Most of public hospitals have overcrowded emergency departments in which identifying patients harboring MDRO and controlling cross-transmission is a huge challenge.19 The lower incidence of MDRO infections among catholic hospitals are more difficult to explain. Although these hospitals merge care delivery to both private and public sectors, in the state of São Paulo these hospitals are located mostly in small towns. Among the 57 catholic hospitals in the state of São Paulo, 27 (47%) are the only hospital in the city in which they are located (data from Sao Paulo Health Care Department). Most of them are overcrowded as well have financial constraints as recently exposed by the lay media in Brazil.20 In this way, we would expect to see similar incidences of BSI caused by MDRO in catholic and public hospitals. One possible explanation for their low incidence of MDRO might be poor laboratory diagnostic performance among catholic hospitals due to shortage of financial resources. Costa et al.21 found an association between laboratories serving hospitals located outside state capitals in Brazil and low laboratory quality. Further investigation is needed to clarify this finding.
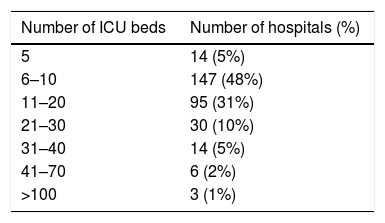
Fifty-three percent of ICUs had 10 or less beds. We believe that this distribution reflects the organization of the Brazilian healthcare system. Tertiary health care is concentrated in large and medium-sized cities. Thus, most municipalities have few ICU beds available. Moreover, 146 out of 645 municipalities host all ICUs in the State of São Paulo. In addition, this indicates inequality in access, especially to tertiary care, of the Brazilian population. Although the State of São Paulo State is the wealthiest and the number of ICU beds per inhabitant is above the national rate, there is a huge difference in access for patients from the private and public sectors, namel 29 versus 14.9/100.000 inhabitants.22 The relationship between the number of ICU beds and the incidence of infections caused by multi-drug resistant organisms is not established in the literature. Even though, Correa et al. found that multi-drug resistance can be a problem even in small hospitals.23
Human development index (HDI) is the socioeconomic indicator most positively correlated (i.e. as HDI increases, the incidence of BSI caused by some MDRO also increases, e.g. CR Acinetobacter sp. and P. aeruginosa, 3rd generation cephalosporin-resistant E. coli and vancomycin-resistant Enterococcus sp.). HDI is a composite of life expectancy at birth plus average income plus educational level and taken in a wider perspective this indicator is associated to equity within a society. Thus, instead of causality it might function as a marker of risky areas for resistance occurrence. Interestingly, MRSA was not associated with higher HDI. This finding is in line with the report by Auguet et al.2 that analyzed a potential association between MRSA carriage and markers of social and material deprivation. The indicators of quality and access of healthcare as well as markers of complexity were not correlated to MDRO incidences. It is important to highlight that socioeconomic covariates were used for adjustment in this study and their contribution as independent factors require testing in further studies.
This study has limitations. First, there is always a possibility of ecologic fallacy in such a design. Thus, we cannot assume that associations raised in aggregated data analyses necessarily occur at the individual level. Concerning the impact of antibiotic use on bacterial resistance, it is difficult to establish an ideal timeframe to explore the gap between antibiotic exposure and laboratory identified resistance. A one-year time lag between use and incidence of BSI caused by MDRO was analyzed. Although other studies were based on 1–2-year time lag, the best approach is not clear.16
Moreover, we assumed that sales in the region were equal to antibiotic use. Patients’ compliance with prescriptions, especially among outpatients, was not evaluated and is indeed hard to achieve since a good surrogate for antibiotic use in large population is lacking. Patient transfers between different hospitals are not formally established on a reference and counter-reference basis in the region. Thus, adjustment for the area-level hospital attendance in order to model potential transmission among facilities was not possible. Furthermore, we have not addressed the antimicrobial stewardship initiatives and policies for preventing HAIs and the spread of MDRO within the studied hospitals. These issues may have had some impact on the outcome, but we could not include these data to adjust for overall antimicrobial use.
Finally, as we did not characterize genotypically the isolates assumptions about transmission between facilities or about a pathway from community to healthcare system were not possible.
ConclusionWe examined a potential association between overall antibiotic use in the state of São Paulo and bacterial resistance within the intensive care setting after adjustment for socioeconomic covariates. The observed association was poor and not consistent for all combinations of antimicrobial groups and pathogens. No association was observed for third generation cephalosporin-resistant K. pneumoniae and E. coli.
Selective pressure exerted at the community level seemed not to affect the incidences of MDRO infection observed in intensive care setting.
Conflicts of interestThe author declares no conflicts of interest.
CRediT authorship contribution statementÍcaro Boszczowski: Conceptualization, Data curation, Formal analysis, Funding acquisition, Investigation, Methodology, Project administration, Resources, Supervision, Validation. Francisco Chiaravalloti Neto: Conceptualization, Data curation, Formal analysis, Funding acquisition, Methodology, Resources, Software, Supervision, Validation. Marta Blangiardo: Formal analysis, Methodology. Oswaldo Santos Baquero: Formal analysis, Methodology. Geraldine Madalosso: Conceptualization, Resources. Denise Brandão de Assis: Conceptualization, Resources. Thais Olitta: Data curation, Resources. Anna S. Levin: Conceptualization, Formal analysis, Funding acquisition, Methodology, Project administration, Resources, Supervision, Validation.
This study was funded by FAPESP — Fundação de Amparo à Pesquisa do Estado de São Paulo (grant #2011/19128-1) http://www.fapesp.br.
The authors thank Professor Carlos Magno Catelo Branco Fortaleza for kindly revising the manuscript.
