


The severity of pulmonary Covid-19 infection can be assessed by the pattern and extent of parenchymal involvement observed in computed tomography (CT), and it is important to standardize the analysis through objective, practical, and reproducible systems. We propose a method for stratifying the radiological severity of pulmonary disease, the Radiological Severity Score (RAD-Covid Score), in Covid-19 patients by quantifying infiltrate in chest CT, including assessment of its accuracy in predicting disease severity.
MethodsThis retrospective, single-center study analyzed patients with a confirmed diagnosis of Covid-19 infection by real-time reverse-transcriptase polymerase chain reaction, who underwent chest CT at hospital admission between March 6 and April 6, 2020. CT scans were classified as positive, negative, or equivocal, and a radiological severity score (RAD-Covid Score) was assigned. Clinical severity was also assessed upon hospital admission.
Results658 patients were included. Agreement beyond chance (kappa statistic) for the RAD-Covid Score was almost perfect among observers (0.833), with an overall agreement of 89.5%. The RAD-Covid Score was positively correlated with clinical severity and death, i.e., the higher the RAD-Covid Score, the greater the clinical severity and mortality. This association proved independent of age and comorbidities. Accuracy of this score was 66.9%.
ConclusionsThe RAD-Covid Score showed good accuracy in predicting clinical severity at hospital admission and mortality in patients with confirmed Covid-19 infection and was an independent predictor of severity.
The most serious clinical presentation of the global pandemic caused by the novel coronavirus disease (Covid-19) is severe acute respiratory syndrome coronavirus 2 (SARS-CoV-2).
The clinical spectrum of the disease is broad, with asymptomatic forms or mild flu conditions in most of the infected. Publications estimate that 15-20% of infected persons develop severe pneumonia and 5-10% require intensive care, with a mortality rate of 1 to 3.5%.1,2
Chest computed tomography (CT) has an important role in the initial diagnosis of Covid-19, as well as in assessing the severity of lung disease and treatment response, in addition to assisting in the search for complications and differential diagnoses.3-20
Some authors have proposed using chest CT in initial Covid-19 diagnosis.12,19,21 Bai et al. found that CT shows high sensitivity in diagnosing the disease (97%, 95% confidence interval [CI]: 95-98%) and proposed using it as an initial diagnostic tool in high-incidence regions.19 Assessing typical chest CT images, Barbosa et al. found sensitivity, specificity, and accuracy of 64.0%, 84.8%, and 79.1%, respectively. However, when the images were typical or equivocal, the method's sensitivity, specificity and accuracy were 92.0%, 62.1% and 70.3%, respectively. They proposed including chest CT in the initial screening strategy for patients with clinical suspicion of the disease in settings with limited resources.21
Some studies have analyzed the correlation between clinical severity of Covid-19 patients upon presentation and the severity of pulmonary involvement in their chest CT scans22-27 Radiological severity has been assessed according to the pattern and extent of pulmonary involvement. The British Society of Thoracic Imaging proposed stratification by four degrees of pulmonary involvement (≤ 25%; 26-50%, 51-75% and > 75 %) and defining disease severity as mild (up to 3 ground glass opacities [GGO] with a diameter of up to 3 cm), moderate/severe (more than 3 GGO or focal opacities with a diameter > 3 cm and/or consolidation) and severe (diffuse or consolidated GGO with architectural distortion).28 At other centers, parenchymal involvement has been quantified as mild (< 25%), moderate (25–50%), or severe (> 50%) pulmonary involvement.25,26
In this study, we propose a simple method for quantifying parenchymal involvement through chest CT scans obtained upon presentation from patients with confirmed Covid-19 infection, thus stratifying the radiological severity of pulmonary disease. We evaluated the accuracy of this score in predicting clinical severity.
Materials and MethodsParticipants and study designThis retrospective, observational and single-center study was approved by the institutional research ethics committee, and the informed consent was waived due to the retrospective nature of the study design. Only patients (a) whose Covid-19 infection was confirmed by real-time polymerase chain reaction (rt-PCR) and (b) who underwent chest CT on admission between March 6 and April 6, 2020 were included. Patients (a) whose rt-PCR examinations were performed more than seven days after chest CT and (b) who were under 18 years of age were excluded.
Clinical data and assessment of clinical severityThe patients’ demographic data (age, sex), comorbidities, and outcome (death or recovery) were collected from the institution's electronic medical records. Clinical severity upon hospital admission was classified according to the institution's treatment protocol for patients with suspected Covid-19: mild (home treatment), moderate (hospitalization), or severe (intensive care unit [ICU] admission). The clinical criteria for medical decisions were:
- •
Home treatment: absence of SARS, with respiratory rate < 24 bpm and oxygen saturation > 93%.
- •
Hospitalization: presence of SARS (respiratory rate ≥ 24 bpm and/or oxygen saturation < 93%) with no signs of acute respiratory failure or severe hemodynamic instability and no need for orotracheal intubation.
- •
ICU admission: presence of SARS (respiratory rate ≥ 24 bpm and/or oxygen saturation < 93%), signs of acute respiratory failure requiring orotracheal intubation, and/or acute worsening of the respiratory pattern, and/or signs of end-organ and/or peripheral hypoperfusion (altered consciousness, elevated lactate, oliguria), and/or distributive shock.
Chest CT scans were obtained through low-radiation-dose on multidetector computed tomography (MDCT) equipment: 160-MDCT (Aquilion Prime CT, Toshiba/Canon), 64-MDCT (Optima 660, GE), 16-MDCT (Somatom Scope,Siemens), 16-MDCT (Alexion, Toshiba/Canon) and 16-MDCT (BrightSpeed, GE Healthcare). The images were acquired during a deep inspiration, in the supine position, without contrast enhancement, and were reconstructed with 0.625 - 1.250 mm section thickness (with an identical increment) using a lung kernel.
Two radiologists, both with eight years of experience in chest imaging and blinded to the clinical and laboratory data, performed a standardized review of all chest CT images at independent workstations. The images were evaluated using the Fleischner Society glossary as a reference,29 including lobar location, distribution, and lesion pattern.
The chest CTs were categorized into three diagnostic imaging groups: positive, equivocal, or negative for suspected Covid-19 pneumonia. For this classification we gather some definitions according to the Radiological Society of North America Expert Consensus Statement on Reporting Chest CT Findings Related to Covid-19,18 as well as other findings in the literature.19,30,31
The following were considered positive CT findings for Covid-19 infection: GGO lesions with or without consolidation and predominantly peripheral and bilateral distribution; multifocal GGO lesions with a rounded morphology, with or without consolidations or “crazy-paving”; the reversed halo sign or other signs of organizing pneumonia. The following were considered equivocal CT findings: nonspecific pulmonary opacities lacking a typical pattern of involvement, such as GGO with diffuse or central distribution, neither rounded, unilateral, some overlapping with typical findings of other underlying pathologies (such as pulmonary fibrosis or emphysema), which sometimes limits diagnosis. The following were considered negative CT findings: a normal chest, lack of significant features or findings suggestive of a pulmonary pathology unrelated to Covid-19 infection (such as bronchopneumonia, tree-in-bud opacities, neoplasia, cavitation, isolated pleural effusion).
Positive or equivocal CT scans were then visually classified for radiological severity according to the extent of pulmonary impairment, using the RAD-Covid Score (Figure 1):
- •
RAD-Covid Score 1 (mild): pulmonary involvement < 25%.
- •
RAD-Covid Score 2 (moderate): pulmonary involvement 25-50%.
- •
RAD-Covid Score 3 (severe): pulmonary involvement > 50%.

For negative CT scans, we used the descriptors:
- •
RAD-Covid Score 0 (normal chest): pulmonary findings lacking or insignificant.
- •
RAD-Covid Score N/A: features of another pulmonary pathology.
After classification, the data underwent interobserver agreement analysis, divergent interpretations were resolved by consensus. Figures 2 to 4 shows examples of our cases and the corresponding RAD-Covid Score.
. In this case, we see ground-glass opacities with additional confluent consolidations and “crazy-paving” pattern.")
. In this case, we see ground-glass opacities, consolidations, septal thickening, and “crazy paving” pattern occupying more than 50% of the total lung volume, with bilateral, peripheral, and central distribution.")
RAD-Covid Score 3. Male patient, 67 years old, with 5 days of symptoms and Covid-19 infection confirmed by rt-PCR. Extensive pulmonary involvement (> 50%). In this case, we see ground-glass opacities, consolidations, septal thickening, and “crazy paving” pattern occupying more than 50% of the total lung volume, with bilateral, peripheral, and central distribution.
. The chest CT can be negative in the first days of symptoms (the literature reports up to 50% normal CT in patients with less than 2 days of symptoms) (20).")
RAD-Covid Score 0. Male patient, 42 years old, with 2 days of symptoms and Covid-19 infection confirmed by rt-PCR. The axial chest CT image shows no relevant pulmonary changes (normal chest CT). The chest CT can be negative in the first days of symptoms (the literature reports up to 50% normal CT in patients with less than 2 days of symptoms) (20).
The analyses were conducted with R software, version 3.6.0. (The R Foundation for Statistical Computing). Exploratory data analysis was performed using summary measures (mean, standard deviation, frequency, and percentage). Interrater agreement was assessed with the Kappa coefficient. The influence of the RAD-Covid Score and other clinical and laboratory variables on clinical severity and mortality was assessed using ordinal logistic regression.
As there were many variables studied and the sample size did not support all of them in a multivariate model, the most important from the researcher´s point-of-view were selected to be included in this model. The stepwise selection criteria made the final choice. The significance level was set at 0.05.
Sensitivity, specificity, and accuracy of the RAD-Covid Score were calculated considering clinical severity. Clinical severity was divided into two groups, one positive including inpatients and the other negative including patients who underwent home treatment. As for radiological severity, CTs classified as RAD-Covid Score 2 and Score 3 were considered positive, and not applicable (NA) CTs, normal CT, or RAD-Covid Score 1 were considered negative.
Results1 - Study population and Clinical Severity Groups
A total of 658 patients were included in the study, 364 females (55.3%) and 294 males (44.7%), whose age ranged from 21 to 100 years, with a mean of 64.9 years and standard deviation (SD) of 18.2 years. Their ages were categorized as follows: 152 patients (23.1%) aged <50 years, 138 patients (21.0%) aged 51 to 60 years; 63 patients (9.6%) aged 61 to 70 years; 139 patients (21.1%) aged 71 to 80 years, and 166 patients (25.2%) aged > 80 years.
The main comorbidities were arterial hypertension (365 patients, 55.6%), diabetes mellitus (202 patients, 30.7%) and cardiovascular disease (86 patients, 13.1%). There was a low occurrence (less than 10%) of other comorbidities such as obesity, asthma/ chronic obstructive pulmonary disease (COPD), neoplasm and chronic kidney disease (CKD). Regarding clinical severity, 232 patients (35.3%) were assigned home treatment, 321 patients (48.8%) were hospitalized, and 105 patients (16.0%) were admitted to the ICU.
2 - Chest CT findings
The chest CTs were classified as positive in 559 patients (84.95%), equivocal in 66 patients (10.93%) and negative in 33 patients (5.02%). The main pulmonary alterations were pure GGO (47.0%) and GGO associated with consolidation (47.4%); crazy-paving pattern (89.9%) and bronchial thickening (72.0%). Most opacities were round (63.5%). The reversed halo sign was observed in 28.8% of the patients. The vast majority had bilateral involvement (88.8%), with either predominantly central and peripheral distribution (59.9%) or only peripheral distribution (34.8%). Pleural effusion was observed in only 55 patients (8.4%) and enlarged lymph nodes were unusual (1.5%). The stratification of RAD-Covid Score was mild in 340 cases (51.7%); moderate in 177 cases (26.9%) and severe in 107 cases (16.3%).
3 – RAD-Covid Score: interobserver agreement and performance in predicting clinical severity
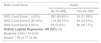
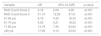
Table 1 shows the interobserver agreement for the RAD-Covid Score. The agreement beyond chance coefficient was 0.833, with high overall agreement (89.5%).
RAD-Covid Score interobserver agreement (kappa = 0.833; overall agreement = 89.5%)
Table 2 shows the association between RAD-Covid Score and clinical severity (home treatment, hospitalization, and ICU admission). An ordinal logistic regression model was created with clinical severity as the dependent variable and RAD-Covid Score as the predictor variable. According to this model, the risk of increased clinical severity were 5.38-fold (95% CI 3.63 to 8.10) higher for patients with RAD-Covid Score 2 (moderate) than for those with RAD-Covid Score 1 (mild). They were 36.04-fold (95% CI 21.31 to 62.27) higher for RAD-Covid Score 3 (severe) than for RAD-Covid Score 1 (mild) (p-value <0.001).
RAD-Covid score and clinical severity correlation
Most patients (88.12%) in the home treatment group were classified as RAD-Covid Score 1, having mild pulmonary involvement. Among the patients in the hospitalization group, 44.5% had RAD-Covid Score 1, 41.6% had RAD-Covid Score 2, and 13.9% had RAD-Covid Score 3. The occurrence of RAD-Covid Score 3 was high in the ICU group (58.10%) and low in the hospitalization (13.9%) and home treatment (0.99%) groups (see Table 2). For severity classification, the RAD-Covid Score had a sensitivity of 61%, a specificity of 88% and an accuracy of 66,9%. (Table 3).
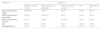
Tables 4 and 5 present the results of the regression in the line of the predictors. The lines that have no results are those that were considered as reference. Some variables showed great homogeneity in the responses, which makes the model quite unstable, so p-value is not presented.
Association of imaging features with clinical severity
GGO: ground glass opacities
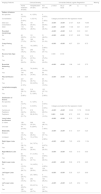
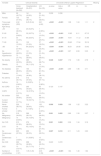
Association of clinical variables with clinical severity
COPD: chronic obstructive pulmonary disease; CVD: cardiovascular disease;
Cerebrovasc Dis: cerebrovascular disease; CKD – chronic kidney disease.
4 – The correlation between imaging findings and clinical severity
Table 4 shows the association between radiological patterns and clinical severity. Patients with a pure GGO pattern were 11.98-fold more likely to have a more severe clinical score than those without opacities. Patients presenting with GGO lesions and consolidation had a 21.57-fold higher risk of a more severe clinical score than patients with no opacities. Patients with round opacities had a 55% lower risk of a more severe clinical score than patients with irregularly shaped opacities. Patients with crazy paving pattern had a 4.97 times higher risk of a more severe clinical score than those without it. Patients with unilateral involvement and a single affected lobe had an 87% and 90% lower risk, respectively, of a more severe clinical score than patients with bilateral involvement and two or more affected lobes.
5 – The correlation between clinical severity at admission and demographic and clinical data
There was no significant difference between men and women regarding clinical severity (Table 5). Patients over 50 years of age had a higher risk of increased clinical severity on admission than those under 50 years (p < 0.001), and those over 80 years of age had a 36.51-fold higher risk (p < 0.001).
The number of comorbidities varied between none and eight per patient, with a mean (±SD) of 1.55±1.37. Patients with hypertension, obesity, diabetes mellitus, current neoplasm, cardiovascular disease, and cerebrovascular disease had a higher risk of increased clinical severity upon hospital admission than patients without comorbidities (p < 0.05).
Symptom onset time ranged from 0 to 32 days, with a mean of 5.7±4.57 days. Those patients with longer symptom duration had more severe conditions upon admission (hospitalization and ICU groups) than those assigned home treatment (p <0.001).
6- Multivariate analysis of RAD-Covid Score, age, and comorbidities in relation to clinical severity upon admission
The variables RAD-Covid Score, age range, and comorbidities (hypertension, obesity, diabetes mellitus, former smoker, current neoplasm, treated neoplasm, cardiovascular disease, cerebrovascular disease, and chronic kidney disease) were included in a multiple ordinal logistic regression model with clinical severity as the response variable for a total of 620 patients. Table 7 and Figure 5 show the stepwise variable selection. Independent predictive factors for increased clinical severity were higher RAD-Covid Score and advanced age. With age as a fixed effect, patients with RAD-Covid Score 2 were 3.18 times more likely to have increased clinical severity than patients with RAD-Covid Score 1, while patients with RAD-Covid Score 3 were 21.10 times more likely to have increased clinical severity than patients with RAD-Covid Score 1. With RAD-Covid Score as a fixed effect, we observed that the older the patient, the greater the risk of more severe clinical conditions. Patients 51-60 years of age were 8.79 times more likely to have increased clinical severity than patients under 50 years of age. Patients over 80 years of age were 17.06 times more likely to have increased clinical severity than patients under 50 years of age.

7 - Correlation of the RAD-Covid Score with fatal outcome
Table 6 shows the results of the logistic regression model, with fatal outcome as the response variable and RAD-Covid Score as the predictor variable. The mortality risk in patients with RAD-Covid Score 2 was 2.63 times higher than that of patients with RAD-Covid Score 1, while the mortality risk in patients with RAD-Covid Score 3 was 7.67 times higher than that of patients with RAD-Covid Score 1.
DiscussionSome studies have investigated the correlation between pulmonary involvement in Covid-19 infection and clinical severity upon admission. In this study we have proposed a simple and convenient method for quantifying imaging results to assess the radiological severity of the disease and identify patients in need of hospitalization.
The RAD-Covid Score had an almost perfect agreement beyond chance coefficient (kappa = 0.833) with high overall agreement (89.5%), showing its reproducibility as an evaluation system. It is based on criteria that can be easily and quickly assessed in chest CT. Two other studies32,33 have used more complex scoring methods to classify the extent of pulmonary involvement, assessing the opacification of several pulmonary regions. Similar to our findings, these methods also obtained excellent interobserver agreement and found higher radiological scores for cases of greater clinical severity.
Our results showed that the proposed RAD-Covid Score was positively correlated with the clinical severity of the disease, i.e., the higher the RAD-Covid Score, the higher the risk of progressing to more severe clinical conditions. The RAD-Covid Score was an independent predictor of severity, along with advanced age and comorbidities, and was positively correlated with risk of fatal outcome.
Regarding demographic data, sex did not significantly influence clinical severity scores, nor was it relevant in another recent publication.32 Age, on the other hand, was a significant predictor of clinical severity, as has been reported in recent publication.39 Patients over 50 years of age had a higher risk of increased clinical severity upon admission than patients under 50 years of age (p <0.001). There was also a significant progressive increase in clinical severity in higher age groups that was especially evident in patients over 80 years of age (odds ratio 36.51).
Regarding comorbidities, hypertension, obesity, diabetes mellitus, current neoplasm, cardiovascular disease, and cerebrovascular disease were correlated with increased clinical severity upon hospital admission. An association of two or more comorbidities increased the risk of clinical severity: the risk of a higher score increased 64% with each additional comorbidity (Table 5). According to the literature, clinical comorbidities in Covid-19 patients are heterogeneous, with the most frequent being hypertension and diabetes mellitus.34,35 Recent publications have observed that patients with chronic diseases are more susceptible to respiratory failure and death from Covid-19.36,37 Another study38 found that any comorbidity in Covid-19 patients predisposes them to a worse prognosis, and the risk increases with every additional comorbidity.
Our study has some limitations, the first of which is that assessing the extent of pulmonary involvement is a subjective process, and there will be disagreement over pulmonary involvement percentages in borderline scores. Although we found a high rate of agreement among observers, artificial intelligence software that can objectively estimate such percentages could lead to even more reliable results. Second, we evaluated chest CT scans upon hospital admission and set no limit on days since symptom onset, which may have impacted the stratification of RAD-Covid Scores. Due to the retrospective nature of the study, our data collection was limited regarding certain comorbidities (COPD and current smoking), some of which were reported incorrectly in the medical records, which probably impacted our results.
In conclusion, in confirmed cases of Covid-19 infection, the proposed RAD-Covid Score classification predicted clinical severity upon hospital admission and fatal outcome with good accuracy, being an independent predictor of clinical severity in relation to age and comorbidities, two variables that also influence outcomes. Thus, we propose that CT severity score should be included in the radiological report as a support tool in clinical decision making.
Funding informationThe authors state that this study has received no funding.
Informed consentWritten informed consent was not required for this retrospective article.
Ethical approvalInstitutional Review Board approval was obtained from Dante Pazzanese Cardiology Institute Ethical Committee CAAE: 32408920.2.0000.5462
We would like to thank our patients, our fellow radiologists at Prevent Senior for providing medical records of suspected cases of Covid-19 infection and, especially, the radiology coordinators for contributing to data collection in these cases: Dr. Affonso Bruno Binda, Dr. Wagner Nóbrega, Dr. Luciano Aguiar, Dr. Arthur Sauma, Dr. Dario Salano Jr., Dr. Demian Travesso and Dr. Márcio Gaspar.
