
Despite the emergence of more effective therapies, hepatitis C virus (HCV) infection remains a serious public health problem at the global level. Currently, this virus is classified into seven genotypes and 67 subgenotypes, which in turn are distributed heterogeneously in Brazil and worldwide. Studies have shown that this genetic divergence results in differences in the progression of chronic disease associated with HCV infection and its treatment.
ObjectiveThe aim of this study was to report the frequency of HCV genotypes in the state of Pará, Northern Brazil, and to assess the association between genotype and different clinical and laboratory characteristics, as well as risk factors for infection.
MethodData from 85 medical records of untreated patients who had chronic hepatitis C infection were analyzed; the patients were evaluated at two hospitals in Belem, Pará, Brazil.
ResultsCirculation of genotypes 1 and 3 was detected, with a higher prevalence of genotype 1 (75.3%) than genotype 3 (24.7%). In addition, there was a predominance of subgenotype 1b (60.34%) compared to 1a (20.69%) and 3a (18.97%). Reuse of needles and/or glass syringes was significantly associated with infection by HCV genotype 1 than genotype 3; however, the small number of patients infected with genotype 3 may have biased the results. No associations between genotype and the evaluated clinical and laboratory characteristics were observed.
ConclusionThis study reinforces the differences in the distribution of HCV genotypes in Brazil and showed no association between HCV genotype and progression of chronic hepatitis C in the studied group.
Hepatitis C virus (HCV) infection has a significant global impact on public health. It affects approximately 71 million people around the world and has caused the death of more than 400,000 carriers per year due to complications from the infection, including hepatic cirrhosis and hepatocellular carcinoma.1,2
HCV belongs to the family Flaviviridae and has a single-stranded RNA genome with approximately 9.6kb in length that encodes a polyprotein of around 3000 amino acid residues, which, in turn, is subsequently cleaved to form structural and nonstructural viral proteins.3
HCV viral RNA polymerase has a high error propensity during successive replications, resulting in high nucleotide substitution rates in the RNA chains of the viral particles produced and, consequently, in wide genotypic variability. Due to genomic sequence differences HCV is classified into seven genotypes and 67 subgenotypes with different degrees of divergence at the genome level.4–6
Different HCV genotypes show characteristic distributions in different regions of the world. Genotype 1 has the highest global prevalence, followed by genotypes 3, 4, and 2. The remaining cases of hepatitis C, approximately 5%, are caused by genotypes 5 and 6. In addition, genotype 7 was isolated in Canada from a single patient from Congo.7–9
Several studies have shown that HCV genotypes have considerable relevance in the clinical management of patients with chronic viral infection and clinical evolution of the disease, such as risk of progression to decompensated cirrhosis10 and occurrence of comorbidities, such as hepatic steatosis,11 as well as distict efficacy of different treatment regimens.12,13 These divergences make HCV genotype analysis an important tool that should be considered in the context of chronic HCV infection. Therefore, the aim of this study was to report the frequency of HCV genotypes in the state of Pará, North Region of Brazil, and to assess the association between HCV genotype with different clinical and laboratory characteristics and risk factors for chronic infection.
Materials and methodsStudy population and data analysisA total of 85 chronic HCV carriers treated at the Santa Casa de Misericórdia do Pará Foundation and at João de Barros Barreto University Hospital of the Federal University of Pará between 2013 and 2016 were evaluated. Patient inclusion criteria were as follows: HCV chronic carrier status, age over 18 years old, detectable HCV RNA, absence of treatment during the collection period, and availability of clinical and biochemical parameters related to hepatic function. Exclusion criteria were as follows: previous diagnosis of autoimmune hepatitis, and coinfection with hepatitis B virus (HBV) or human immunodeficiency virus (HIV).
Ethical aspectsThis study was approved by the Research Ethics Committee of João de Barros Barreto University Hospital (protocols 962.537/2015 and 2.165.948/2017) and by the Research Ethics Committee of the Santa Casa de Misericórdia do Pará Foundation (protocol 772.782/2014). All patients who agreed to participate in the study signed an informed consent form.
Biological samplesFor the genotype analysis and biochemical tests, venous blood from each patient was collected in tubes containing separator gel to obtain serum, in tubes containing ethylenediaminetetraacetic acid anticoagulant, and in tubes containing sodium citrate.
Liver biopsy samples were obtained from the patients after medical indication for evaluation of possible changes in the liver parenchyma. To obtain the specimens, a Trucut needle was used with ultrasound guidance. Hepatic biopsy specimens were examined at the Department of Pathology, Federal University of Pará (UFPA), using the criteria for histopathological diagnosis according to the METAVIR scale classification.14
Clinical and laboratory assessmentThe eligible patients underwent clinical evaluations at the respective health services of each hospital and answered questionnaires about risk factors for infection, risk of worsening, and history of liver disease. Abdominal ultrasound procedures, upper gastrointestinal endoscopy, liver biopsy, and evaluation of biochemical markers of liver function and liver damage were also performed. All obtained clinical and laboratory data were entered into medical records and subsequently stored in a database for analysis.
Viral load quantification and genotype determinationThe quantitative analysis of HCV viral load (VL) and determination of viral genotypes and subgenotypes were performed at the Central Laboratory of the state of Pará (LACEN, for its acronym in Portuguese). VL was determined using RT-PCR (AMPLICOR MONITOR®, Roche Molecular Systems). The viral genotypes and subgenotypes were determined by sequencing the 5’ untranslated region of HCV using the Linear Array Hepatitis C Virus Genotyping Test (LiPA – Line Probe Assay – Roche Diagnostics).
Statistical analysisBioEstat version 5.4 and SPSS version 22 (SPSS Inc., Chicago, IL, USA) were used for statistical processing of the data. Qualitative parameters were compared using the chi-square test, Fisher's exact test, and the G test. Initially, the Kolmogorov-Smirnov test was used to evaluate normality of continuous variables, which were compared using Student's t-test or Mann–Whitney test. Rejection of the null hypothesis, referring to the lack of an association between the factors evaluated, was established with a two-tailed p-value less than 0.05.
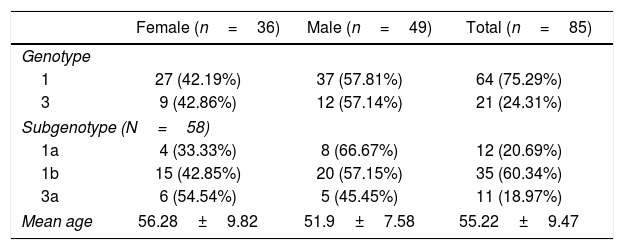
ResultsThe mean age of the evaluated patients was 55.22±9.47 years. The molecular analysis detected genotypes 1 and 3 but no genotypes 2, 4, 5, 6 or 7. In addition, no mixed genotypes were detected. Genotype 1 was detected in 64 (75.3%) cases, whereas genotype 3 was detected in 21 (24.7%) cases. Among the 58 samples in which the HCV subgenotype was analyzed, 12 (20.69%) contained subgenotype 1a, 35 (60.34%) 1b, and 11 (18.97%) subgenotype 3a (Table 1).
General data of the analyzed patients.
| Female (n=36) | Male (n=49) | Total (n=85) | |
|---|---|---|---|
| Genotype | |||
| 1 | 27 (42.19%) | 37 (57.81%) | 64 (75.29%) |
| 3 | 9 (42.86%) | 12 (57.14%) | 21 (24.31%) |
| Subgenotype (N=58) | |||
| 1a | 4 (33.33%) | 8 (66.67%) | 12 (20.69%) |
| 1b | 15 (42.85%) | 20 (57.15%) | 35 (60.34%) |
| 3a | 6 (54.54%) | 5 (45.45%) | 11 (18.97%) |
| Mean age | 56.28±9.82 | 51.9±7.58 | 55.22±9.47 |
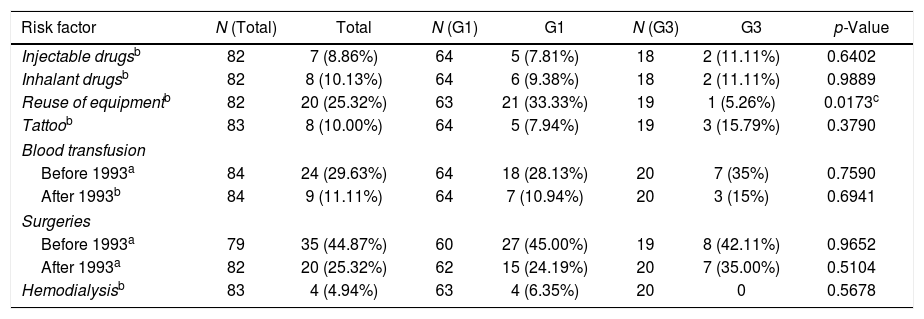
The main identified risk factor for HCV acquisition was surgery before 1993, followed by transfusions, other surgeries after that year, and reuse of needles and/or glass syringes; the latter risk factor had a statistically significant association with viral genotype 1 infection. Viral genotype 3 infection was significantly associated with sharing needles and/or glass syringes (p=0.0173). The other factors were not associated with any of the genotypes (Table 2).
Data on risk factors for HCV acquisition.
| Risk factor | N (Total) | Total | N (G1) | G1 | N (G3) | G3 | p-Value |
|---|---|---|---|---|---|---|---|
| Injectable drugsb | 82 | 7 (8.86%) | 64 | 5 (7.81%) | 18 | 2 (11.11%) | 0.6402 |
| Inhalant drugsb | 82 | 8 (10.13%) | 64 | 6 (9.38%) | 18 | 2 (11.11%) | 0.9889 |
| Reuse of equipmentb | 82 | 20 (25.32%) | 63 | 21 (33.33%) | 19 | 1 (5.26%) | 0.0173c |
| Tattoob | 83 | 8 (10.00%) | 64 | 5 (7.94%) | 19 | 3 (15.79%) | 0.3790 |
| Blood transfusion | |||||||
| Before 1993a | 84 | 24 (29.63%) | 64 | 18 (28.13%) | 20 | 7 (35%) | 0.7590 |
| After 1993b | 84 | 9 (11.11%) | 64 | 7 (10.94%) | 20 | 3 (15%) | 0.6941 |
| Surgeries | |||||||
| Before 1993a | 79 | 35 (44.87%) | 60 | 27 (45.00%) | 19 | 8 (42.11%) | 0.9652 |
| After 1993a | 82 | 20 (25.32%) | 62 | 15 (24.19%) | 20 | 7 (35.00%) | 0.5104 |
| Hemodialysisb | 83 | 4 (4.94%) | 63 | 4 (6.35%) | 20 | 0 | 0.5678 |
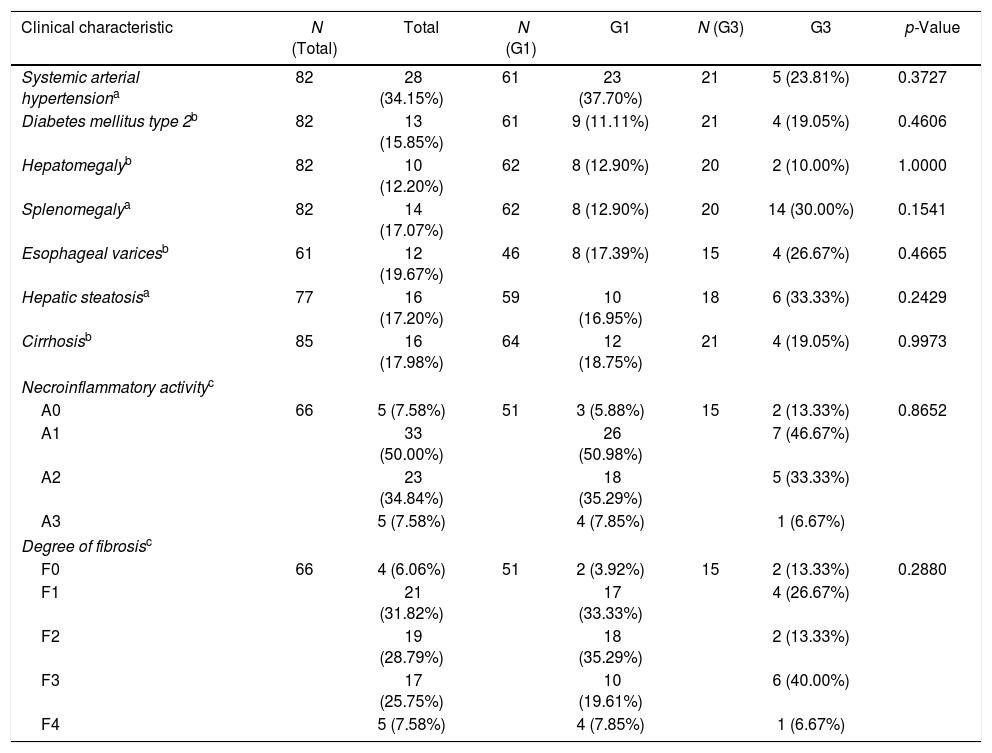
All 85 patients underwent clinical evaluations, 61 (81.33%) endoscopy, and 77 (90.59%) abdominal ultrasound. In the context of the clinical assessment, systemic hypertension (SAH) was the most frequent clinical feature in the evaluated patients, occurring in 28 (34.15%) of 82 patients who were evaluated for comorbidities. However, when comparing the data of patients with different genotypes, no significant differences were observed in the frequencies of any of the variables evaluated. Liver biopsies were performed in 66 (77.65%) patients. No differences were observed between genotypes neither in the distribution of necroinflammation scores (p=0.8652) nor in the degree of liver fibrosis (p=0.288) (Table 3).
Clinical and histopathological data of the patients.
| Clinical characteristic | N (Total) | Total | N (G1) | G1 | N (G3) | G3 | p-Value |
|---|---|---|---|---|---|---|---|
| Systemic arterial hypertensiona | 82 | 28 (34.15%) | 61 | 23 (37.70%) | 21 | 5 (23.81%) | 0.3727 |
| Diabetes mellitus type 2b | 82 | 13 (15.85%) | 61 | 9 (11.11%) | 21 | 4 (19.05%) | 0.4606 |
| Hepatomegalyb | 82 | 10 (12.20%) | 62 | 8 (12.90%) | 20 | 2 (10.00%) | 1.0000 |
| Splenomegalya | 82 | 14 (17.07%) | 62 | 8 (12.90%) | 20 | 14 (30.00%) | 0.1541 |
| Esophageal varicesb | 61 | 12 (19.67%) | 46 | 8 (17.39%) | 15 | 4 (26.67%) | 0.4665 |
| Hepatic steatosisa | 77 | 16 (17.20%) | 59 | 10 (16.95%) | 18 | 6 (33.33%) | 0.2429 |
| Cirrhosisb | 85 | 16 (17.98%) | 64 | 12 (18.75%) | 21 | 4 (19.05%) | 0.9973 |
| Necroinflammatory activityc | |||||||
| A0 | 66 | 5 (7.58%) | 51 | 3 (5.88%) | 15 | 2 (13.33%) | 0.8652 |
| A1 | 33 (50.00%) | 26 (50.98%) | 7 (46.67%) | ||||
| A2 | 23 (34.84%) | 18 (35.29%) | 5 (33.33%) | ||||
| A3 | 5 (7.58%) | 4 (7.85%) | 1 (6.67%) | ||||
| Degree of fibrosisc | |||||||
| F0 | 66 | 4 (6.06%) | 51 | 2 (3.92%) | 15 | 2 (13.33%) | 0.2880 |
| F1 | 21 (31.82%) | 17 (33.33%) | 4 (26.67%) | ||||
| F2 | 19 (28.79%) | 18 (35.29%) | 2 (13.33%) | ||||
| F3 | 17 (25.75%) | 10 (19.61%) | 6 (40.00%) | ||||
| F4 | 5 (7.58%) | 4 (7.85%) | 1 (6.67%) | ||||
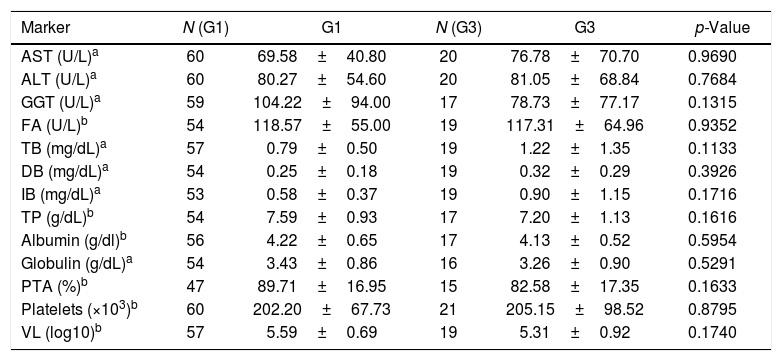
Additionally, the analysis of biochemical markers and VL showed no statistically significant differences between the observed values of patients infected with neither genotype 1 and nor genotype 3 (Table 4).
Laboratory markers according to HCV genotype.
| Marker | N (G1) | G1 | N (G3) | G3 | p-Value |
|---|---|---|---|---|---|
| AST (U/L)a | 60 | 69.58±40.80 | 20 | 76.78±70.70 | 0.9690 |
| ALT (U/L)a | 60 | 80.27±54.60 | 20 | 81.05±68.84 | 0.7684 |
| GGT (U/L)a | 59 | 104.22±94.00 | 17 | 78.73±77.17 | 0.1315 |
| FA (U/L)b | 54 | 118.57±55.00 | 19 | 117.31±64.96 | 0.9352 |
| TB (mg/dL)a | 57 | 0.79±0.50 | 19 | 1.22±1.35 | 0.1133 |
| DB (mg/dL)a | 54 | 0.25±0.18 | 19 | 0.32±0.29 | 0.3926 |
| IB (mg/dL)a | 53 | 0.58±0.37 | 19 | 0.90±1.15 | 0.1716 |
| TP (g/dL)b | 54 | 7.59±0.93 | 17 | 7.20±1.13 | 0.1616 |
| Albumin (g/dl)b | 56 | 4.22±0.65 | 17 | 4.13±0.52 | 0.5954 |
| Globulin (g/dL)a | 54 | 3.43±0.86 | 16 | 3.26±0.90 | 0.5291 |
| PTA (%)b | 47 | 89.71±16.95 | 15 | 82.58±17.35 | 0.1633 |
| Platelets (×103)b | 60 | 202.20±67.73 | 21 | 205.15±98.52 | 0.8795 |
| VL (log10)b | 57 | 5.59±0.69 | 19 | 5.31±0.92 | 0.1740 |
ALT, alanine aminotransferase; AST, aspartate aminotransferase; GGT, gamma glutamyltransferase; FA, alkaline phosphatase; TB, total bilirubin; DB, direct bilirubin; IB, indirect bilirubin (IB); total proteins (TP); PTA, prothrombin time of activity.
The genotypic distribution of HCV follows patterns related to both geographic and cultural factors.8,9 In the present study, only genotypes 1 and 3 were detected, and there was a higher prevalence of genotype 1 (74.7%) than genotype 3 (25.3%). In fact, the studies performed by Petruzziello et al.8 and Blach et al.9 showed a predominance of these genotypes in Brazil, with genotype 1 presenting a prevalence of 64.8% and genotype 3 a prevalence of 30.2%. Additionally, these studies showed the occurrence, even at low frequency, of genotypes 2 (4.6%), 4 (0.2%), and 5 (0.1%) in the country, unlike what was found in this study.
Although the distributions of HCV genotypes are well established in Brazil, they vary between regions and states. Even so, the predominance of genotype 1 over genotype 3 was also observed in several states, including Ceará,15 Pernambuco,16 Rio Grande do Sul,17,18 Santa Catarina,19 Amapá, Paraná, Rio de Janeiro, Rondônia and São Paulo,17 in addition to states in the Midwest region.17,20
In the state of Pará, prevalence rates of 65.7% and 23.3% had been previously observed in patients for genotypes 1 and 3, respectively21; these prevalence rates are similar to those found in the present study. In addition, other studies also found a predominance of genotype 1 compared to genotype 3 in blood donors, and the frequencies of genotype 1 (from 89.1%22 to 93.1%23) were higher than those found in patients in this study. Unlike the present study, genotype 2 was detected in studies conducted by Sawada et al.23 and Guimarães et al.21 at frequencies of 0.6 and 4.4, respectively, indicating the presence of these genotypes in the state.
In the present study, a predominance of subtype 1b (61.1%) over 1a (20.4%) and 3a (18.5%) was demonstrated. These findings are not in agreement with the distribution of subgenotypes observed in Brazil, which are characterized by an equal prevalence between the 3 subtypes: 31%, 33.4%, and 30.2%, for subgenotype 1a, 1b and 3a, respectively.9 The predominance of subgenotype 1b has also been observed in the states of Amapá, Pará, Pernambuco and Roraima.16,17,21
There are also discrepancies between the HCV subgenotype distributions observed in this study and those found in other Brazilian states. In the states of Goiás, Paraná, Rio Grande do Sul, and São Paulo, there was a predominance of subgenotype 1a and a less remarkable representation of subgenotype 1b.17,20 In addition, in the state of Rio de Janeiro and the Federal District, genotype 3a predominated over subgenotypes 1a and 1b.17,20 In the analysis of the evaluated risk factors, there was a significant association between HCV genotype 1 chronic infection and sharing of glass syringes and/or needles, but the small number of patients with genotype 3 could have compromised power to show an association. Considering other risk factors, although Petruzziello et al.13 showed that illicit drug use was associated with genotype 3, this association was not found in the present study, in accordance with data reported by García-Montalvo and Galguera-Colorado.24
In terms of clinical characteristics, some studies have shown an association between genotype 3 and hepatic steatosis,25–27 which was not observed in the present study. One possible cause for this difference is the small sample size, especially those with viral genotype 3. Associations of HCV genotypes with other clinical characteristics are contradictory, according to data from the literature. Other authors showed that HCV genotype 3 infection, compared to other genotype infections, may be associated with more rapid progression of liver disease and greater chance of developing cirrhosis and hepatocellular carcinoma.25,28,29 In turn, it was shown that patients with this genotype presented a milder degree of fibrosis than did patients with other genotypes.30 Moreover, although a higher risk of hepatocellular carcinoma has been reported to be associated with genotype 1 compared to genotype 3,31 other studies did not find differences between degrees of fibrosis in patients with different HCV genotypes,32,33 as in the present study.
In general, data on the association between HCV genotypes and biochemical markers are also controversial. While some studies, such as the present study, have not found associations between any of the markers and viral genotypes,24,33 others observed higher levels of aspartate aminotransferase (AST), alanine aminotransferase (ALT) and alkaline phosphatase (AP)34 in patients with viral genotype 1 compared to those with genotype 3.35
In addition, some studies have shown that HCV genotype 1 was associated with a higher VL,13,35 while others have shown that this parameter was independent of viral genotype,33 as found in the present study. Finally, the small sample size could be a limitation of the present study and highlights the need for continuous studies using larger sample sizes to draw conclusions on the association between HCV genotypes and progression of chronic hepatitis C.
ConclusionThis study demonstrates the predominance of HCV genotype 1 over genotype 3 in the state of Pará, especially in patients who reported sharing glass syringes and/or needles. This study also reinforces the existence of differences in the prevalence of viral genotypes and subgenotypes in different regions of Brazil, which has relevance, especially in terms of treatment. Another important aspect of this study is the comparison performed in terms of epidemiological, clinical and laboratory characteristics among patients with different genotypes, which showed that in the studied region, genotype had no significant interference in the clinical course of the disease, which warrants further investigations with larger sample sizes to confirm this preliminary evidence.
Conflicts of interestThe authors declare no conflicts of interest.
FundingThe study was supported by funding from the National Council for Scientific and Technological Development of Brazil (CNPQ # 480128/2013-8; #301869/2017-0) and the Federal University of Pará (PROPESP/PAPQ/2019).
We thank all the patients asked and willing to participate in the study.
