The aim of the present study was to obtain information about deaths due to sepsis in São Paulo from 2004 to 2009 and their relationship with geographical distribution.
MethodsCauses of death, both main and secondary, were defined according to the codes of the International Classification of Disease version 10 (ICD-10) contained in the database. Sepsis, septic shock, multiple organ failure, pneumonia, urinary tract infection, peritonitis and other intraabdominal infections, skin and soft tissue infections (including surgical wound infection) and meningitis were considered as immediate cause of death or as the condition leading to the immediate cause of death related or associated to sepsis.
ResultsIn the analyzed period, there was a 15.3% increase in the absolute number of deaths from sepsis in São Paulo. The mean number of deaths during this period was 28,472±1566. Most deaths due to sepsis and sepsis-related diseases over the studied period occurred in a hospital or health care facility, showing that most of the patients received medical care during the event that led to death. We observed a significant concentration of deaths in the most populous regions, tending more toward the center of the city.
ConclusionsGeoreferencing data from death certificates or other sources can be a powerful tool to uncover regional epidemiological differences between populations. Our study revealed an even distribution of sepsis all over the inhabited areas of São Paulo.
Sepsis is a syndrome resulting from systemic manifestations of infection associated with high incidence and mortality rate. Also, care of patients with sepsis costs as much as $50,000 per patient, resulting in an economic impact for society of nearly $17 billion annually in the United States alone.1,2 Demographic and socioeconomic variables, pre-existing diseases, and access to health care are factors that affect the incidence and mortality of patients with severe sepsis and septic shock.2–6 For instance, an American retrospective study showed a higher incidence of sepsis among blacks, men, and people from abject poverty and urbanization. The same groups also had higher rates of mortality.3
Disparities also occur as the source of infection. Men have more respiratory infections, while women have more genitourinary infections. Regardless of the infection site in men, infections with Gram-positive bacteria are more prevalent.5 The same is true for black Americans, who have more comorbidities and longer hospitalization. The reasons for these disparities are not well understood. In Brazil, studies on the epidemiology of sepsis are limited to intensive care units from some public and private hospitals. Those studies have showed that the mortality rate is higher in Brazil compared to other countries.2,7
Georeferencing, which relates information to the geographic location, is an important and innovative tool in epidemiological studies8,9 that has been used in various scenarios,10–12 aiming to clarify aspects of geographic distribution. The application of the methodology of georeferencing assists in studies of population mobility correlating with socioeconomic and geographic segmentation of a given area. In fact, the Brazilian population has important socioeconomic disparities in access to health care, which could impact sepsis outcomes. Hence, georeferencing may be used for understanding the relationship between socioeconomic attributes and the outcomes of septic patients.
The aim of the present study was to obtain information about deaths due to sepsis in São Paulo from 2004 to 2009 and their relationship with geographical distribution.
Materials and methodsDeaths database was extracted from “Programa de Aprimoramento das Informações de Mortalidade” (PRO-AIM; “Mortality Information Improvement Program”), coordinated by the São Paulo County Health Authority and Data Processing Company (PRODAM). Death certificate information was collected for residents who died within the county boundaries. Addresses were standardized and cross-match coded with a street database using fuzzy techniques aiming to clean strange characters or errors. Death certificates from 2004 to 2009 were analyzed for age, sex, primary and secondary cause of death, patients’ address, and place of death.
Causes of death, both main and secondary, were defined according to the codes of the International Classification of Disease version 10 (ICD-10) contained in the database. Sepsis, septic shock, multiple organ failure, pneumonia, urinary tract infection, peritonitis and other intra-abdominal infections, skin and soft tissue infections (including surgical wound infection), and meningitis were considered as immediate cause of death or as the condition leading to the immediate cause of death related or associated to sepsis.
When death occurred in hospitals or health institutions, these establishments were identified by the National Health Establishments Registry (Cadastro Nacional de Estabelecimentos de Saúde (CNES)) or Health System Ambulatory Information (Sistema de Informações Ambulatoriais do SUS (SIASUS)) databases. Correspondence of health institutions’ addresses between the two databases was made to obtain code uniformity in order to avoid duplicate or missing information. The spatial distribution of deaths was performed using patients’ residence address and place of death.
Human development index (HDI; United Nations Development Program) was used to grade the socioeconomic status of São Paulo County districts. Differences between districts were compared for number of deaths, their causes, and their relation to the HDI and mortality coefficients. Data from the Brazilian 2000 Census (Instituto Brasileiro de Geografia e Estatística (IBGE)) was used to generate mortality coefficients for every district in São Paulo County, according to population estimates for that year.
Comparison of two proportions was done using Z statistics with normal distribution and 95% confidence intervals or Chi-square tests when appropriate. Spearman linear regression was used for correlation between the HDI and mortality rates. Maps were generated using the MAPINFO Professional 9.0, using data from the year 2009 as an example. All statistical analyses were performed with Excel 2010 (Microsoft, USA) and SPSS v.13.0 (IBM Corporation, New York, USA). For all analyses, two-sided p-values <0.05 were considered significant. The study was approved by the Ethics Committee in Research of the Secretaria Municipal de Saúde (CEP-SMS). All patient records and information were anonymized and de-identified prior to analysis.
ResultsTotal deaths due to sepsisIn the analyzed period, there was a 15.3% increase in the absolute number of deaths from sepsis in São Paulo, rising from 27,135 in 2004 to 31,286 in 2009. The mean number of death during this period was 28,472±1566. For an estimated mean population of 10,965,000 inhabitants during this period, the mortality coefficient was 259.55/100,000 inhabitants.
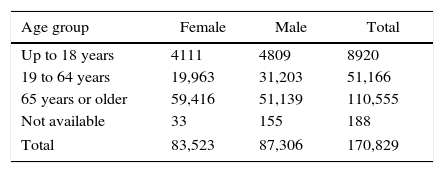
Distribution of deaths according to gender, age, and age groupThe number of deaths from sepsis in São Paulo increased with age of the patients, being 8905 (5.2%) up to 18 years, 51,166 (29.9%) from 19 to 64 years, and 110,080 (64.4%) for 65 years or older. Age information was not available for 680 patients (0.4%). The distribution of deaths according to gender was nearly equal for both sexes: 51% in males and 49% in females. This distribution remained stable during all periods from 2004 to 2009. However, when we analyzed deaths by sex, stratifying them by age groups, there were more deaths among males in the age group up to 18 years (53.9% vs. 46.1%) and 19–64 years (61% vs. 39%). In the age group above 65 years, the proportion reversed to 46.3% for males and 53.7% for females. These differences were statistically significant (Table 1).
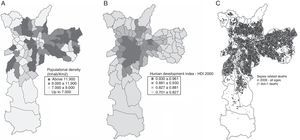
Distribution of deaths according to regions and the human development indexWe choose the year 2009 to calculate the mortality rate per 100,000 inhabitants in different regions of São Paulo. The mortality rate was higher in regions where the HDI was higher. One possible explanation for this fact is that in regions with a higher HDI life expectancy was higher. Consequently, there was a greater likelihood of patients developing sepsis or sepsis-related infections, especially pneumonia, since these conditions were more frequent in the elderly. The mortality rate for pneumonia varied from 71 per 100,000 inhabitants in the county's southern region, which was the most populated and had the lowest HDI (0.794), to 135 per 100,000 inhabitants in the county's central region, which was less populated and had the highest HDI (0.906) (r=0.87; p<0.05).
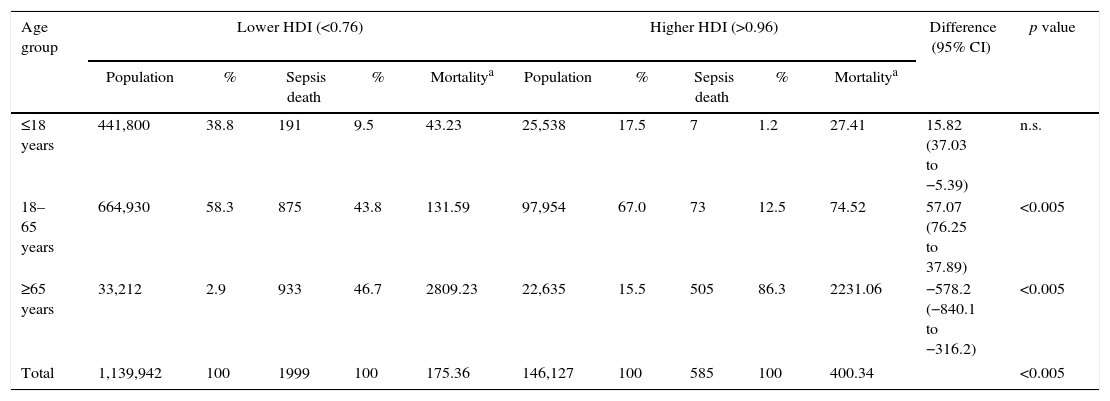
We analyzed sepsis deaths in two population groups: one in districts with HDI less than 0.76 and the other in districts with an HDI higher than 0.96. Districts with a lower HDI had a population of 1,139,942 inhabitants, having 39% of the population in the below-18-years age group, 58% between 19 and 64 years, and 3% 65 years or older. Higher-HDI districts, with 146,127 inhabitants, had a different age group distribution: 17% up to 18 years, 67% between 19 and 64 years, and 15% 65 years or older. In districts with a lower HDI, percentage of deaths were 10% in the age group up to 18 years, 44% for the age group between 19 and 64 years, and 47% for the group 65 years or older. Mortality coefficients were 43.23, 131.59, and 2809.23 per 100,000, respectively. For districts with a higher HDI, percentage of deaths were 1% for the age group up to 18 years, 12% between 19 and 64 years, and 86% for 65 years or older. Mortality coefficients were 27.41, 74.52, and 2231.06 per 100,000, respectively.
When compared to districts with a high HDI, low-HDI districts had a higher percentage of deaths in the age groups up to 18 years (1% vs. 10%; difference=0.9; 95% confidence interval [CI]: 0.07–0.12; Z=6.99; p<0.0001) and between 19 and 64 years (12% vs. 44%; diff.=0.32; 95% CI=0.28–0.36; Z=14.07; p<0.0001). However, in high-HDI districts death rates were higher for the age group above 65 years (47% vs. 86%; diff.=-0.39; 95% CI=−0.44 to −0.34; Z=16.66; p<0.0001). Mortality coefficient was not statistically different in the age group up to 18 years between low- and high-HDI districts, but it was significantly higher in the age group between 19 and 64 years in the low-HDI districts (p<0.001). For the age group of 65 years or older, the mortality coefficient was higher in the high-HDI districts (p<0.001). Nevertheless, the mortality coefficient for the whole population was higher for the high-HDI districts (Table 2).
Distribution of population and sepsis deaths by age groups in low- and high-HDI districts in the city of São Paulo in the year of 2009.
| Age group | Lower HDI (<0.76) | Higher HDI (>0.96) | Difference (95% CI) | p value | ||||||||
|---|---|---|---|---|---|---|---|---|---|---|---|---|
| Population | % | Sepsis death | % | Mortalitya | Population | % | Sepsis death | % | Mortalitya | |||
| ≤18 years | 441,800 | 38.8 | 191 | 9.5 | 43.23 | 25,538 | 17.5 | 7 | 1.2 | 27.41 | 15.82 (37.03 to −5.39) | n.s. |
| 18–65 years | 664,930 | 58.3 | 875 | 43.8 | 131.59 | 97,954 | 67.0 | 73 | 12.5 | 74.52 | 57.07 (76.25 to 37.89) | <0.005 |
| ≥65 years | 33,212 | 2.9 | 933 | 46.7 | 2809.23 | 22,635 | 15.5 | 505 | 86.3 | 2231.06 | −578.2 (−840.1 to −316.2) | <0.005 |
| Total | 1,139,942 | 100 | 1999 | 100 | 175.36 | 146,127 | 100 | 585 | 100 | 400.34 | <0.005 | |
HDI, human development index; CI, confidence interval; n.s., non-significant.
Chi-square: 289,91; p<0.001 (for number of deaths).
Most deaths due to sepsis over the studied period occurred in a hospital or health care facility, showing that most of the patients received medical care during the event that led to death. However, about 6% of cases died before reaching a medical facility or receiving proper medical care, most of them at a patient's home. Most deaths occurred in hospitals and health care facilities; 52.4% were in public hospitals (112 institutions, 33%), 46.4% in private hospitals (178 institutions, 53%), and 1.2% in non-identified places (48 institutions, 14%). The average load of deaths was 79% higher in public institutions, which had a mean of 737 deaths per institution compared to 411 in private institutions.
Distribution of deaths according to age group and addressUsing a georeferencing technique, deaths due to sepsis and illnesses potentially related to sepsis that occurred in São Paulo in 2009 were plotted on a map (Fig. 1). We observed a significant concentration of deaths in the most populous regions, tending more toward the center of the city. However, in sparsely populated extremes there were few cases of deaths.
Distribution of deaths according to public or private hospitalsThe distribution of deaths by private or public hospitals showed a tendency for the concentration of cases of death by regions covered by the hospital, as seen in Fig. 2A and B. However, as several hospitals serving the private network were located in the downtown area, there was a great movement of patients in some regions, a fact less evident to public hospitals, where cases tended to focus in the coverage area of these services.
When we distributed the cases of death by place of occurrence (private or public hospital) and by age group, there was a greater percentage of deaths in the age group of 65 years or older in private hospitals, following the general distribution of deaths. However, in public hospitals, despite the similar distribution, there were more deaths in the age group between 19 and 64 years.
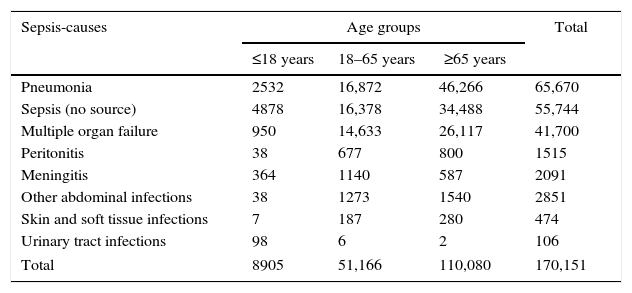
Distribution of deaths according to causePneumonia, sepsis, and multiple organ failure were the main causes of death reported on death certificates for the period studied (Table 3). However, when we studied the proportion of each cause in different age groups, we noted that the proportion varied. In the age group up to 18 years, most deaths were due to infection of the urinary tract, while at the age of 65 years or older, pneumonia, sepsis, and multiple organ failure were the most common causes.
Main causes of sepsis by age group from 2004 to 2009.
| Sepsis-causes | Age groups | Total | ||
|---|---|---|---|---|
| ≤18 years | 18–65 years | ≥65 years | ||
| Pneumonia | 2532 | 16,872 | 46,266 | 65,670 |
| Sepsis (no source) | 4878 | 16,378 | 34,488 | 55,744 |
| Multiple organ failure | 950 | 14,633 | 26,117 | 41,700 |
| Peritonitis | 38 | 677 | 800 | 1515 |
| Meningitis | 364 | 1140 | 587 | 2091 |
| Other abdominal infections | 38 | 1273 | 1540 | 2851 |
| Skin and soft tissue infections | 7 | 187 | 280 | 474 |
| Urinary tract infections | 98 | 6 | 2 | 106 |
| Total | 8905 | 51,166 | 110,080 | 170,151 |
We looked at secondary causes of death to explain differences in death rates for higher- and lower-HDI districts. For the age group up to 18 years, there was a significant difference in secondary causes of death only for pulmonary and neurological diseases, being higher in lower-HDI districts (p<0.001). In lower-HDI districts, for the age group between 19 and 64 years, the proportion of deaths due to secondary causes was significantly higher for pulmonary, neoplastic, cardiovascular, digestive, infectious, endocrine, neurologic, and genitourinary diseases (p<0.001). For the age group of 65 years or older, we found a higher death rate from secondary causes in districts with higher HDI (p<0.001) of pulmonary, neoplastic, cardiovascular, digestive, infectious, endocrine, neurologic, genitourinary, and bone and joint diseases.
DiscussionAs far as we know, no study has dealt with georeferencing of sepsis to date. However, georeferencing is a well-known and widely used technique in many conditions in the medical literature. During the six-year study period, the absolute number of sepsis or sepsis-related infection deaths had a 15.6% increase. This can be attributed to the population increase associated and with better diagnosis of these conditions, as during the studied period educational campaign efforts were made regarding the Surviving Sepsis Campaign (SSC).13 The number of deaths increased with age as expected but was distributed almost equally between genders. However, for the younger age groups deaths were more numerous for the male gender, which is perhaps a reflex of hormonal protection in the female gender. For the older group, with a larger amount of women being in menopause, the proportion of females was higher.14
We observed a positive correlation between HDI and the mortality coefficient. HDI is composed of many variables, one of them being life expectancy at birth. Thus, HDI varies with population age, and in a region with longer life expectancy it will be higher because a greater proportion of the population will be older. As the mortality coefficient is higher in older population groups, correlation between the two variables is positive. In districts with greater HDI, the population is older and the mortality coefficient is higher.
Sepsis mortality is higher in low-income countries, probably because of lack of access to health care facilities.15 Sepsis acquisition risk is higher in poorer neighborhoods.16 Sepsis death rate was higher in districts with lower HDI, but in the age group of 19 to 64 years it was disproportionately higher. Thus, sepsis reaches higher death rates in younger and poorer populations in São Paulo. However, the mortality coefficient for the whole population was higher in high-HDI districts, again reflecting an older population with greater number of deaths. The majority of deaths occurred in health care facilities, but the burden was higher for the public health system, which attends the majority of the Brazilian population.
Our study showed an even distribution of sepsis among all inhabited districts of the São Paulo municipality, even when split by age groups. Access to health care facilities was almost universal in case of severe diseases and tended to concentrate around the nearest hospital, indifferently of public or private institutions. Great displacements were not the rule, since the city is relatively well served by many hospitals. Still, this may not occur in other localities in the country. The demand for high-complexity health services tends to concentrate in large urban centers, generating great displacements of patients all over the country.17
When considering the cause of death declared on death certificates, pneumonia ranked first, followed by sepsis and multiple organ failure. In the Brazilian Sepsis Epidemiological Study (BASES),2 respiratory infections accounted for the majority of hospital admissions as a cause of sepsis or septic shock. The same was observed in the Sepsis Brazil Study,7 where pulmonary infections were responsible for 69% of sepsis or septic shock cases. However, when we look at the relative frequency of each cause by age group, pneumonia and sepsis were relatively more frequent in the older age groups, and in younger patients they were an important cause, despite their low absolute numbers. A European pediatric community-acquired septic shock study showed that pneumococcal disease comprised 10.8% of all infections and 9.8% of urinary tract infections, but the majority of the cases in this sample had meningococcal disease (23.6%).18 This study suggested that urinary tract infections had almost equal importance of pneumonia as a cause of septic shock in European children.
The secondary cause analysis revealed some striking differences between populations living in districts with high or low HDI in the three age groups. For the age group up to 18 years old, more individuals who died in the low-HDI group had a secondary cause in the pulmonary and neurological ICD-10 categories. Similarly, in the age group between 19 and 64 years in the low-HDI group, a significantly higher proportion of individuals had secondary causes for several ICD-10 categories (pulmonary, neoplastic, cardiovascular, digestive, infectious, endocrine, neurologic, and genitourinary diseases). However, when we looked at the above-65 group, these proportions were higher for the high-HDI group in the very same ICD-10 categories. This demonstrated that the patients in the 19-to-64-years group had more comorbidities, suggesting that this population had the worst health conditions, probably related to poverty. This could partially explain the higher death rate observed in this age group.
In conclusion, georeferencing data from death certificates or other sources can be a powerful tool to uncover regional epidemiological differences between populations. Our study revealed an even distribution of sepsis and sepsis-related infections all over the inhabited areas of the city of São Paulo. However, differences between low- and high-income areas and age groups were demonstrated below this veil of equal-case geographic distribution. This kind of study is able to show relevant epidemiological information that can be used to implement public health measures by governmental and private sectors of the health industry.
Conflicts of interestThe authors declare no conflicts of interest.


