


To evaluate the diagnostic accuracy of the Radiological Society of North America (RSNA) classification system for coronavirus disease 2019 (COVID-19) pneumonia compared to pre-pandemic chest computed tomography (CT) scan images to mitigate the risk of bias regarding the reference standard.
Materials and methodsThis was a retrospective, cross-sectional, diagnostic test accuracy study. Chest CT scans, carried out from May 1 to June 30, 2020, and from May 1 to July 17, 2017, were consecutively selected for the COVID-19 (positive reverse transcription-polymerase chain reaction [RT-PCR] for severe acute respiratory syndrome coronavirus 2 result) and control (pre-pandemic) groups, respectively. Four expert thoracic radiologists blindly interpreted each CT scan image. Sensitivity and specificity were calculated.
ResultsA total of 160 chest CT scan images were included: 79 in the COVID-19 group (56 [43.5–67] years old, 41 men) and 81 in the control group (62 [52–72] years old, 44 men). Typically, an estimated specificity of 98.5% (95% confidence interval [CI] 98.1%–98.4%) was obtained. For the indeterminate classification as a diagnostic threshold, an estimated sensitivity of 88.3% (95% CI 84.7%–91.7%) and a specificity of 79.0% (95% CI 74.5%–83.4%), with an area under the curve of 0.865 (95% CI 0.838–0.895), were obtained.
ConclusionThe RSNA classification system shows strong diagnostic accuracy for COVID-19 pneumonia, even against pre-pandemic controls. It can be an important aid in clinical decision-making, especially when a typical or indeterminate pattern is found, possibly advising retesting following an initial negative RT-PCR result and streamlining early management and isolation.
Coronavirus disease 2019 (COVID-19), caused by the severe acute respiratory syndrome coronavirus 2 (SARS-CoV-2), has spread globally, becoming an ongoing pandemic responsible for more than four million deaths worldwide and more than 550,000 casualties in Brazil, the second most affected country in the world to date.1 Consequently, computed tomography (CT) of the chest has been employed to assist in the diagnosis and assessment of potential complications and prognosis of patients with COVID-19.2,3 Since findings associated with COVID-19 pneumonia can be found in other lung diseases,4 some radiological societies have published guidelines with objective criteria to improve accuracy and reproducibility of chest CT findings, notably the Radiological Society of North America (RSNA) expert consensus,5 among others.6,7
The RSNA classification system for reporting COVID-19 pneumonia classified chest CT findings into four categories (negative, atypical, indeterminate, and typical; Table 2). Studies have shown its noteworthy diagnostic performance with specific diagnostic thresholds (indeterminate and typical), as well as moderate-to-substantial inter-reader agreement, mostly adopting the SARS-CoV-2 reverse transcription-polymerase chain reaction (RT-PCR) test as the reference diagnostic standard.8–17
According to published meta-analyses,18–20 the quality of early articles designed to assess the accuracy of chest CT in the diagnosis of pneumonia caused by SARS-CoV-2 was considered suboptimal. Limited adherence to reporting guidelines and a high risk of bias, especially regarding patient selection and the reference diagnostic standard, have been reported. A more recent meta-analysis confirmed a high risk of bias regarding the reference test, specifically because RT-PCR testing was not repeated in all patients with an initial negative result in some studies.17 Concern over chest CT diagnostic accuracy during overlapping seasonal flu caused by influenza has also been raised.17,20
To address these concerns, a single-center, retrospective, cross-sectional, diagnostic test accuracy study was conducted to evaluate the RSNA classification system for reporting COVID-19 pneumonia5 using chest CT images of patients with RT-PCR-confirmed SARS-CoV-2 infection and pre-pandemic samples, true negatives for COVID-19, as controls. The RSNA classification may be an important aid in clinical decision-making, encouraging retesting following an initial negative RT-PCR result and streamlining early management and isolation.
Material and MethodsThis single-center, retrospective, cross-sectional study was approved by the local institutional review board. Informed consent was waived because no risk was presented to the participants. All relevant clinical information was obtained from our hospital's electronic medical records system.
Participant selectionCOVID-19 groupFrom May 1 through June 30, 2020, chest CT scan images of inpatients, from both wards and emergency departments, with confirmed COVID-19 by at least one positive RT-PCR result within seven days of the CT scan date were consecutively selected. This period was chosen to match the initial regional rising incidence period of COVID-1921 as well as the historic regional peak incidence periods of influenza pneumonia and acute respiratory distress syndrome.22
Control groupFrom May 1 through July 17, 2017, chest CT scan images of inpatients, as requested by emergency department physicians, that had at least one of the following text descriptors were consecutively selected:
- 1.
Clinical information: pneumonia, infection, respiratory, dyspnea, cough, fever, acute, flu, viral, hypoxemia, tachypnea, shortness of breath, bronchopneumonia (BCP), desaturation, viral;
- 2.
Radiological report: pneumonia, inflammatory, infectious, ground glass, viral.
The following exclusion criteria were applied to the COVID-19 group only:
- 1.
RT-PCR results were indeterminate or unavailable (e.g., external analysis).
The following exclusion criteria were applied to both groups:
- 1.
Patient <18 years old;
- 2.
Technically limited/low-quality images (e.g., severe respiratory motion artifacts).
Chest CT scans were routinely requested at the discretion of the attending physician considering the institutional protocol, pneumonia severity criteria, laboratory tests, and comorbidities.
RT-PCR-positive results were considered as the reference diagnostic standard for COVID-19 diagnosis. It was a two-site test, oropharyngeal and nasopharyngeal swab, with analysis performed by the institution's own laboratory.
The control group selection period, approximately two years prior to the emergence of COVID-19, was considered the reference standard for the absence of the disease. Search and selection were performed using a business intelligence software in our Radiology Information System/Picture Archiving and Communication System (RIS/PACS) database.
CT acquisition techniqueImages were obtained using an eight-row multidetector CT (MDCT) scanner (BrightSpeed Edge, GE Medical Systems, USA), a 16-row MDCT scanner (Brilliance 16, Philips Healthcare, the Netherlands), or a 64-row MDCT scanner (Aquilion 64, Toshiba Medical Systems, Japan), with patients in the supine position and at full inspiration. All scans were volumetric acquisitions (slice thickness: 1.0–2.0 mm) and were reconstructed with a high-spatial-frequency algorithm. Images were stored and analyzed using PACS (IMPAX 6.6.1.3525, Agfa HealthCare, Belgium). When used, iodinated nonionic intravenous contrast medium was injected into a peripheral vein at a dose of 1–2 mL/kg of body weight.
CT image reading and classificationChest CT scan findings were anonymized for patient identification/information and scanning date and then codified and randomly sorted in a predefined sequence by our PACS operated by the authors who did not participate in the interpretation. For convenience, only the axial series (lung window) of each scan was used.
The readers were four thoracic radiologists (reader 1 [CSF], 15 years of experience; reader 2 [LF], 8 years of experience; reader 3 [TSG], 20 years of experience; and reader 4 [MST], 10 years of experience) who were blinded to each other and to patient identification, clinical/laboratory information, previous imaging tests, RT-PCR results, and scanning date.
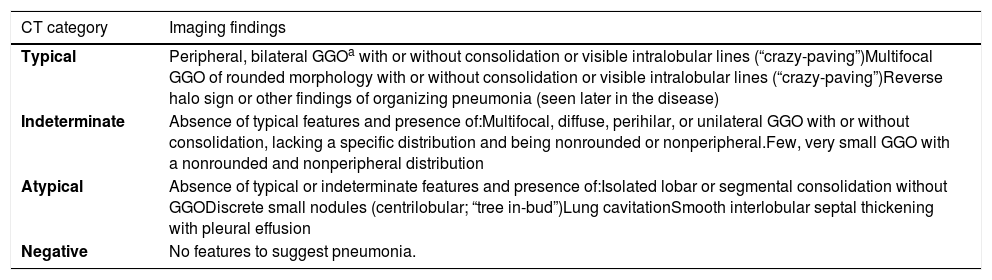
All chest CT scans were consecutively interpreted once and individually by all four reviewers in a predefined sequence. Radiological findings were classified according to the four categories proposed by the RSNA consensus (Table 1).5 No final consensus or agreement between readers was sought.
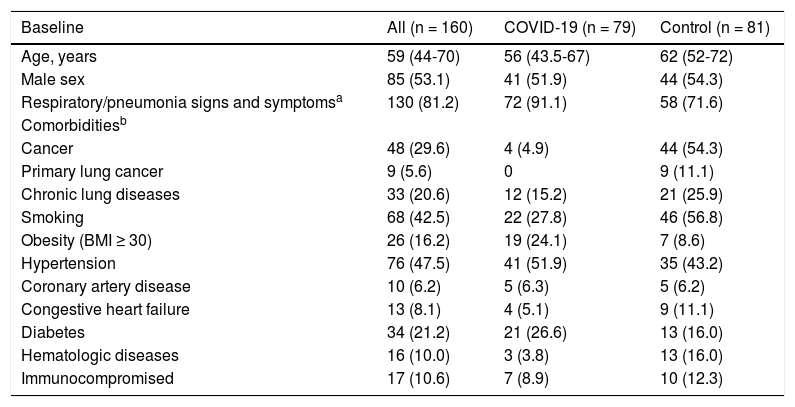
Baseline variables and clinical data.
| Baseline | All (n = 160) | COVID-19 (n = 79) | Control (n = 81) |
|---|---|---|---|
| Age, years | 59 (44-70) | 56 (43.5-67) | 62 (52-72) |
| Male sex | 85 (53.1) | 41 (51.9) | 44 (54.3) |
| Respiratory/pneumonia signs and symptomsa | 130 (81.2) | 72 (91.1) | 58 (71.6) |
| Comorbiditiesb | |||
| Cancer | 48 (29.6) | 4 (4.9) | 44 (54.3) |
| Primary lung cancer | 9 (5.6) | 0 | 9 (11.1) |
| Chronic lung diseases | 33 (20.6) | 12 (15.2) | 21 (25.9) |
| Smoking | 68 (42.5) | 22 (27.8) | 46 (56.8) |
| Obesity (BMI ≥ 30) | 26 (16.2) | 19 (24.1) | 7 (8.6) |
| Hypertension | 76 (47.5) | 41 (51.9) | 35 (43.2) |
| Coronary artery disease | 10 (6.2) | 5 (6.3) | 5 (6.2) |
| Congestive heart failure | 13 (8.1) | 4 (5.1) | 9 (11.1) |
| Diabetes | 34 (21.2) | 21 (26.6) | 13 (16.0) |
| Hematologic diseases | 16 (10.0) | 3 (3.8) | 13 (16.0) |
| Immunocompromised | 17 (10.6) | 7 (8.9) | 10 (12.3) |
Radiological Society of North America-Proposed Reporting Language (5).
| CT category | Imaging findings |
|---|---|
| Typical | Peripheral, bilateral GGOa with or without consolidation or visible intralobular lines (“crazy-paving”)Multifocal GGO of rounded morphology with or without consolidation or visible intralobular lines (“crazy-paving”)Reverse halo sign or other findings of organizing pneumonia (seen later in the disease) |
| Indeterminate | Absence of typical features and presence of:Multifocal, diffuse, perihilar, or unilateral GGO with or without consolidation, lacking a specific distribution and being nonrounded or nonperipheral.Few, very small GGO with a nonrounded and nonperipheral distribution |
| Atypical | Absence of typical or indeterminate features and presence of:Isolated lobar or segmental consolidation without GGODiscrete small nodules (centrilobular; “tree in-bud”)Lung cavitationSmooth interlobular septal thickening with pleural effusion |
| Negative | No features to suggest pneumonia. |
The sample size was calculated to estimate the sensitivity and specificity of the classification proposed by the RSNA to diagnose SARS-CoV-2 pneumonia using the formulas described by Buderer (1996).23 For a 95% confidence interval (CI), a desired precision of 10%, and a sensitivity and specificity of 75%, a sample size of 145 participants was reached. The final sample size was 162 participants, with 10% added for possible losses.
Statistical analysisQualitative variables were expressed as absolute and relative frequencies (n [%]), and quantitative variables as median and first and third quartiles (median [Q1–Q3]). The distribution of quantitative variables was assessed by graphical analysis of the histogram and the quartile–quartile plot.
Associations between qualitative variables were assessed using the Pearson χ² test of independence with Yates’ continuity correction. Fleiss kappa statistic24 was used to evaluate inter-reader classification agreement among the four readers.
A generalized linear mixed-effects model with binomial distribution was used to estimate the predicted probability of positivity for COVID-19. The estimated probabilities were then used to calculate a receiver operating characteristic (ROC) curve, which computed the area under the curve (AUC), sensitivity, and specificity. The AUC was calculated using the Wilcoxon nonparametric approach by comparing the predicted probabilities of all discordant pairs of observations.25 Empirical bootstrap (with 10,000 replications) was used to evaluate the 95% CIs. Analyses were performed using the R software, version 4.0.3.26
ResultsParticipant selection and clinical baselineCOVID-19 groupWithin the chosen period, 82 chest CT scan images met the COVID-19 group inclusion criteria, with 79 remaining after excluding three for technical limitations.
Control groupFor the control group, 83 CT scan images met the inclusion criteria, with 81 remaining after excluding one underage patient at the time of scanning and one for technical limitations.
Clinical baselineThe male sex relative frequency and median patient age were 51.9% and 56 (43.5–67) years in the COVID-19 group and 54.3% and 62 (52–72) years in the control group, with p = 0.8819 and 0.0693, respectively. In the COVID-19 group, the median time between RT-PCR sample collection and chest CT scan was one day (0–2 days), whereas the median time between symptom onset and chest CT scan was eight days (5–16 days). Population baseline and clinical data are summarized in Table 1.
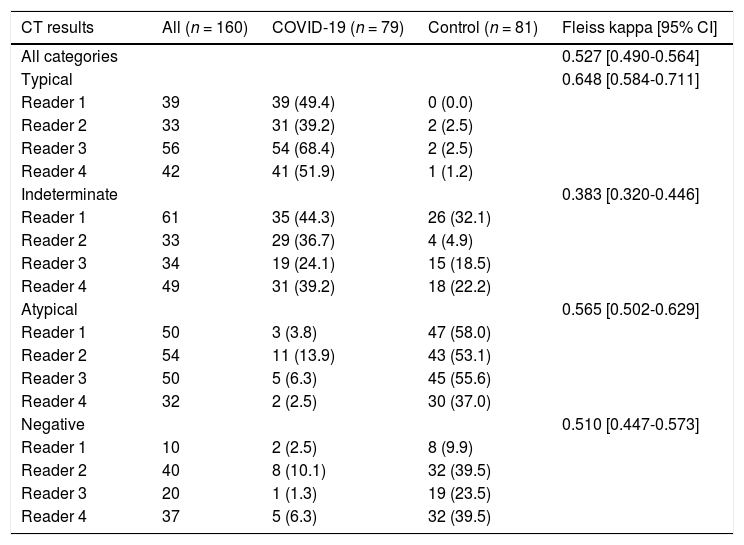
CT image reading and classificationThe results of the CT scan classification for each reader are shown in Table 3.
CT results and inter-reader agreement (Fleiss kappa).
Notes: Qualitative variables are expressed as absolute and relative frequencies (n [%]). Percentages (%) shown are relative to the number of the respective category assigned within each group (i.e., COVID-19 and control) by each reader. The reported Fleiss kappa values are for all readers when all categories are considered simultaneously, as well as for each category individually.
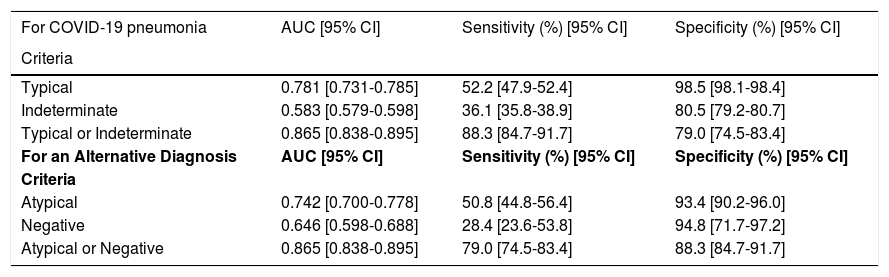
Diagnostic accuracy was evaluated according to different possible positivity criteria (Table 4):
- 1.
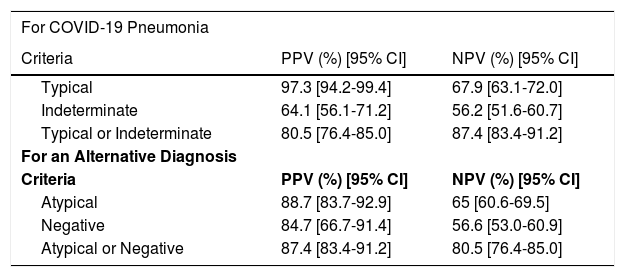
Typical classification (Fig. 2) as a positive test for COVID-19 pneumonia, with an estimated sensitivity of 52.2% (95% CI 47.9%–52.4%), a specificity of 98.5% (95% CI 98.1%–98.4%), an AUC of 0.781 (95% CI 0.731–0.785), a positive predictive value (PPV) of 97.3% (95% CI 94.2%–99.4%), and a negative predictive value (NPV) of 67.9% (95% CI 63.1%–72.0%).
- 2.
Indeterminate classification (Fig. 3) as a positive test for COVID-19 pneumonia, with an estimated sensitivity of 36.1% (95% CI 35.8%–38.9%), a specificity of 80.5% (95% CI 79.2%–80.7%), an AUC of 0.583 (95% CI 0.579–0.598), a PPV of 64.1% (95% CI 56.1%–71.2%), and an NPV of 56.2% (95% CI 51.6%–60.7%).
- 3.
Typical or indeterminate classification as a positive test for COVID-19 pneumonia, with an estimated sensitivity of 88.3% (95% CI 84.7%–91.7%), a specificity of 79.0% (95% CI 74.5%–83.4%), an AUC of 0.865 (95% CI 0.838–0.895), a PPV of 80.5% (95% CI 76.4%–85.0%), and an NPV of 87.4% (95% CI 83.4%–91.2%).
RSNA diagnostic performance.
AUC = area under the curve; COVID-19 = coronavirus disease 2019.
The ROC curve is shown in Fig. 1.
 curve for the possible coronavirus disease 2019 (COVID-19) pneumonia positivity criteria evaluated.")


Atypical (Fig. 4) and negative classifications were evaluated as criteria for an alternative diagnosis, returning specificities of 93.4% (95% CI 90.2%–96.0%) and 94.8% (95% CI 71.7%–97.2%), respectively.

Predictive values computed for each scenario are shown in Table 5.
Predictive values.
Note: Table shows the predictive values of different diagnostic criteria of the RSNA Classification for COVID-19 pneumonia and for an alternative diagnosis.
Inter-reader overall agreement analysis, including all four categories, demonstrated a moderate Fleiss kappa value of 0.527 (95% CI 0.490–0.564). Agreement was highest for the typical classification, with a substantial Fleiss kappa value of 0.648 (95% CI 0.584–0.711), and lowest for the indeterminate classification, with a fair Fleiss kappa value of 0.383 (95% CI 0.320–0.446) (Table 3).
DiscussionThe RSNA-proposed chest CT imaging classification can provide excellent diagnostic accuracy for COVID-19 pneumonia, with high specificity and sensitivity, depending on the chosen diagnostic threshold. The classification also showed a noteworthy inter-reader agreement when tested against pre-pandemic controls affected by diverse respiratory diseases and treated at the emergency department, specifically during the regional peak incidence periods of influenza pneumonia and acute respiratory distress syndrome.
Our findings suggest that the typical pattern is highly associated with COVID-19 pneumonia, even when compared to pre-pandemic controls. Moreover, an atypical or negative pattern suggests an alternative diagnosis, but should be interpreted with caution, as it does not rule out COVID-19 diagnosis, nor the possibility of COVID-19 pneumonia. In addition, different possible diagnostic thresholds for COVID-19 pneumonia were explored, attaining one of high specificity and another of high sensitivity, with typical pattern only and typical plus indeterminate patterns combined, respectively.
Using pre-pandemic controls, that is, true negatives, results agree with the current body of evidence showing, as already mentioned, good correlation between the RSNA classification and the RT-PCR results, as well as a consistent inter-reader agreement. Moreover, two possible diagnostic thresholds that could be interpreted and used according to specific clinical context needs were analyzed.
We ascertained the role of RSNA-proposed CT patterns for COVID-19 pneumonia diagnosis, especially the strong association between the typical pattern and COVID-19 pneumonia and between the atypical pattern and an alternative diagnosis. Moreover, we propose that the two possible diagnostic thresholds may aid in clinical decision-making considering their advantages in specific contexts, primarily combined with the reference test, but also particularly helpful when the reference test is scarcely or not readily available. The typical pattern was highly specific and thus strongly suggestive of COVID-19 pneumonia diagnosis against a differential diagnosis that could demand a different management. Both typical and indeterminate patterns for a positive test were highly sensitive, thus considering retesting following an initial negative RT-PCR result as well as to streamline early management and isolation until a definitive diagnosis can be made.
Our study has limitations, including the usual profile of the hospitalized patient population at our institution, whose normally high prevalence of admissions due to chronic conditions (e.g., heart failure, cancer) may be related to the statistically significant difference in the presence of pneumonia/respiratory signs and symptoms between the two groups. Another possible reason is the undervaluation of said symptoms in the pre-pandemic context, especially when of mild or vague nature, or even when linked with chronic conditions. Nevertheless, differential diagnosis is not restricted to infections of obvious presentation or of infectious etiology,4 which in our opinion justifies the inclusion of patients without explicitly reported signs/symptoms. We also recognize that there is concern that the control patients and settings do not ideally match the review question, but we understand that it is an unavoidable issue given the case-control selection nature of the study. The limit of seven days between RT-PCR sampling and CT scanning for the COVID-19 group may also be of concern, but it was necessary as CT scans were reserved for selected cases and often not immediately ordered in agreement with the institutional protocol and the principle of justification in a broad perspective, as RT-PCR testing was readily available and rapidly processed in-house. Finally, a fair Fleiss kappa-value was found for the indeterminate classification, possibly related to the intrinsic unspecificity of its imaging findings, magnified by the use of four readers; however, further analysis is necessary for clarification.
In conclusion, when tested against pre-pandemic controls, the RSNA classification system for reporting COVID-19 pneumonia showed prominent diagnostic performance, in agreement with the current literature, with potentially high specificity and sensitivity provided by its different diagnostic thresholds. Thus, we believe it can be an important aid in clinical decision-making, especially when a typical or indeterminate pattern is found, considering retesting following an initial negative RT-PCR and streamlining early management and isolation.
This study was financed in part by the Fundo de Incentivo à Pesquisa (FIPE)/HCPA.
The authors declare no conflict of interest associated with this manuscript.
