The aim of this study was to compare pharmacokinetic characteristics between intermittent infusion and continuous infusion of vancomycin for critically ill patients admitted to intensive care units.
MethodsIntermittent therapy was administered for 60minutes and prescribed as a loading dose of 30mg/kg and continued with 15mg/kg q12h. Continuous infusion was prescribed as a loading dose of 30mg/kg followed by 30mg/kg on constant infusion pump. Blood samples from vancomycin intermittent infusion group were collected 1h before third dose, 1h, 8h and 24h after third dose infusion. Blood samples from vancomycin continuous infusion group were collected 1h after loading dose, 12h, 24h, 36h, and 48h after continuous infusion initiation.
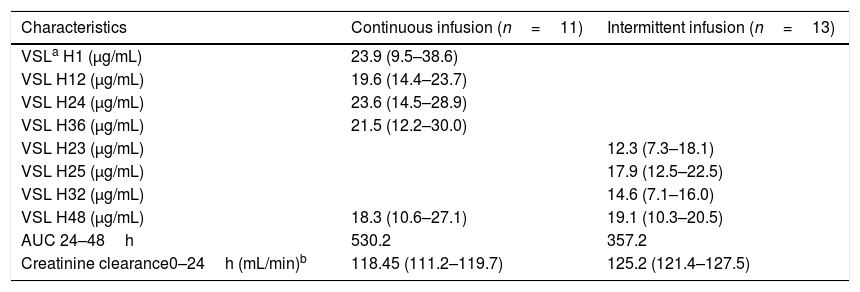
ResultsMedian serum concentration of continuous infusion group at 24-hour was 23.59μg/mL [14.52–28.97], while of intermittent infusion group at 23-hour was 12.30μg/mL [7.27–18.12] and on 25-hour was 17.58μg/mL [12.5–22.5]. Medians AUC24–48h were 357.2mg.h/L and 530.2mg.h/L for intermittent infusion and continuous infusion groups, respectively (p=0.559).
ConclusionVancomycin CI reached steady state earlier, which guaranteed therapeutic levels from the first day and made it possible to manage therapeutic drug monitoring faster.
Patients admitted to intensive care unit (ICU) are under risk for infections by methicillin-resistant Staphylococcus aureus (MRSA) strains1,2 and vancomycin continues to be an important therapeutic option for Gram-positive infections.3 This glycopolypeptide inhibits the second stage of cell-wall synthesis of Gram-positive bacteria4 and because of its area under the curve (AUC) dependent pharmacodynamics, it does not require a high peak level to be effective.5 Moreover, vancomycin usage is growing due to increasing incidence of MRSA infections which is related to high mortality rate. Therefore, vancomycin still has a major role in the treatment of these infections.6
Once it is eliminated through glomerular filtration, therapeutic drug monitoring (TDM) is needed to avoid the well-known vancomycin nephrotoxicity as a result of drug accumulation in the presence of renal impairment. Recently, Infectious Diseases Society of American (IDSA) changed recommendations to vancomycin TDM protocol. Previously, treatment recommendation was based on trough serum concentrations and aimed between (i) 15–25μg/mL for severe infections caused by the MRSA, such as bacteremia, endocarditis, pneumonia, or (ii) 10–15μg/mL to non-severe infections.7 Nevertheless, IDSA updated recommendations which no longer support vancomycin treatment based only on trough levels and emphasizes the importance of Bayesian software programs to individually fit serum levels of patient's pharmacokinetics to achieve a ratio ≥400 between AUC and minimum inhibitory concentration (MIC).5,8 Serum target levels of the drug may be achieved with continuous infusion (CI) or intermittent infusion (II). Values above and below these concentrations are considered inadequate and need adjustment. CI reaches target serum levels faster than II, with lower daily doses and fewer adverse reactions.9 Moreover, CI is convenient for dosage adjustment since it can be done by modifying infusion speed, and not by changing dose interval, as it is the case with II.10 However, there are no reports in the literature showing difference in patient's outcomes between both types of administration.11,12
There are several pharmacodynamic (PD) parameters to be considered when prescribing vancomycin, including trough serum bactericidal titers, AUC and MIC. Moise-Broder et al. described an AUC24h/MIC ratio>350–400 related to better clinical and bacteriological outcomes on patients with pneumonia by Staphylococcus aureus.13 However, this PD target is usually extrapolated to other site of infections, which must be used cautiously. Besides it, AUC:MIC>400 with MRSA MIC above 1.5–2.0μg/mL is rarely achieved.14
The aim of this study was to compare pharmacokinetic characteristics between II and CI vancomycin therapy for critically ill patients admitted to intensive care units. This study was approved by the ethical committee at PUCPR (number 75526017.0.0000.0020). Informed authorization was obtained from all patients.
This was an observational prospective study performed from January 2018 to July 2019, comparing pharmacokinetic/pharmacodynamic parameters and clinical data of patients with suspected or documented Gram-positive infections receiving vancomycin conventional dose (intermittent infusion) or continuous infusion. Treatment regimens were prescribed at the discretion of the medical assistant team. Vancomycin blood concentrations were collected as described below.
Inclusion criteria were patients admitted to Intensive Care Unit of Hospital Universitario Cajuru (Curitiba, Paraná, Brazil) for whom vancomycin was prescribed for presumed or documented Gram-positive infections. Exclusion criteria were (i) history of hypersensitivity to vancomycin, (ii) life expectancy≤48h, (iii) renal dysfunction (serum creatinine≥2.5mg/dl or estimated creatinine clearance≤40mL/min), (iv) age<18 years or an inability to obtain informed consent. Demographic data, including age, sex, weight, height, and infectious diagnosis, were collected upon enrollment in the study. Serum creatinine was measured, and creatinine clearance was estimated on each day of the study. Patients were followed up until ending vancomycin treatment. Acute Kidney Injury Network classification (AKIN) was used to evaluate renal toxicity from both CI and II vancomycin groups.
All patients received vancomycin (ABL, Cosmópolis, Brazil) reconstituted according manufacture’ s guidelines. Intermittent therapy was administered for 60minutes and prescribed as a loading dose of 30mg/kg and continued with 15mg/kg q12h. Continuous infusion was prescribed as a loading dose of 30mg/kg followed by 30mg/kg on constant infusion pump. Blood samples from vancomycin intermittent infusion group were collected 1h before third dose, 1h, 8h and 24h after third dose infusion. Blood samples from vancomycin continuous infusion group were collected 1h after loading dose, 12h, 24h, 36h and 48h after continuous infusion initiation, as previous published studies.15 All samples were measured by Siemens Dimension Xpand Plus® HM clinical analyzer (Siemens, Munich, Germany).
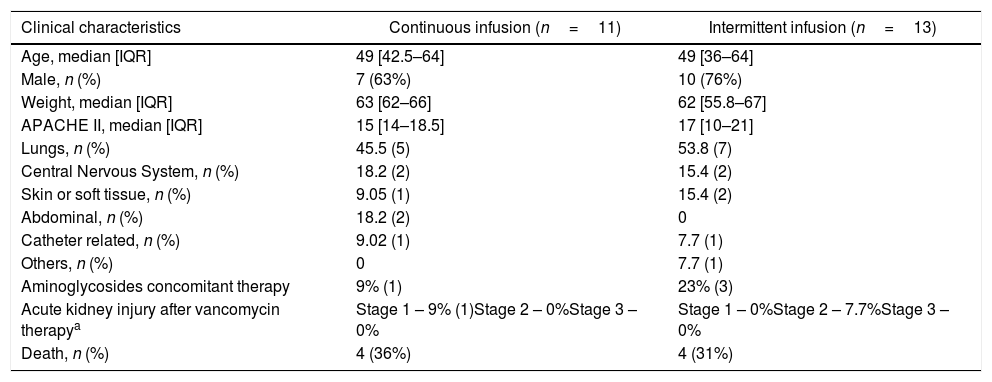
Twenty-three patients were enrolled in this study, 11 on CI group (63% male) and 12 on II group (76% male). Clinical characteristics were similar between CI and II group (Table 1). Most frequent sites of infection were lungs (n=12) and central nervous system (CNS) (n=4), followed by skin/soft tissue (n=3) and abdominal (n=2).
Pharmacokinetic characteristics of vancomycin therapy.
| Characteristics | Continuous infusion (n=11) | Intermittent infusion (n=13) |
|---|---|---|
| VSLa H1 (μg/mL) | 23.9 (9.5–38.6) | |
| VSL H12 (μg/mL) | 19.6 (14.4–23.7) | |
| VSL H24 (μg/mL) | 23.6 (14.5–28.9) | |
| VSL H36 (μg/mL) | 21.5 (12.2–30.0) | |
| VSL H23 (μg/mL) | 12.3 (7.3–18.1) | |
| VSL H25 (μg/mL) | 17.9 (12.5–22.5) | |
| VSL H32 (μg/mL) | 14.6 (7.1–16.0) | |
| VSL H48 (μg/mL) | 18.3 (10.6–27.1) | 19.1 (10.3–20.5) |
| AUC 24–48h | 530.2 | 357.2 |
| Creatinine clearance0–24h (mL/min)b | 118.45 (111.2–119.7) | 125.2 (121.4–127.5) |
Data are presented as medians (25th to 75th percentiles).
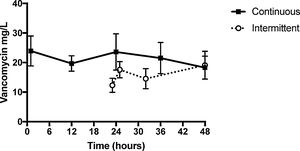
Blood samples from II group were collected 23h after first dose (H23) and 1 (H25), 8 (H32) and 24h (H48) after third infusion. Median serum vancomycin concentrations were 12.30, 17.58, 14.56 and 19.10μg/mL, respectively. Blood samples from CI group were collected 1h after loading dose (H1) and 12 (H12), 24 (H24), 36 (H36) and 48h (H48) after CI started. Median serum vancomycin concentrations were 23.91, 19.68, 23.59, 21.53 and 18.28μg/mL, respectively (Table 1). II and CI vancomycin AUC24–48h were calculated (Table 2). Medians [IQR] AUC24–48h were 357.2mg.h/L [150.1–564.3] and 530.2mg.h/L [108–958.4] from II and CI groups, respectively (p=0.559) (Fig. 1).
Clinical characteristics of patients treated with continuous and intermittent infusion of intravenous vancomycin.
| Clinical characteristics | Continuous infusion (n=11) | Intermittent infusion (n=13) |
|---|---|---|
| Age, median [IQR] | 49 [42.5–64] | 49 [36–64] |
| Male, n (%) | 7 (63%) | 10 (76%) |
| Weight, median [IQR] | 63 [62–66] | 62 [55.8–67] |
| APACHE II, median [IQR] | 15 [14–18.5] | 17 [10–21] |
| Lungs, n (%) | 45.5 (5) | 53.8 (7) |
| Central Nervous System, n (%) | 18.2 (2) | 15.4 (2) |
| Skin or soft tissue, n (%) | 9.05 (1) | 15.4 (2) |
| Abdominal, n (%) | 18.2 (2) | 0 |
| Catheter related, n (%) | 9.02 (1) | 7.7 (1) |
| Others, n (%) | 0 | 7.7 (1) |
| Aminoglycosides concomitant therapy | 9% (1) | 23% (3) |
| Acute kidney injury after vancomycin therapya | Stage 1 – 9% (1)Stage 2 – 0%Stage 3 – 0% | Stage 1 – 0%Stage 2 – 7.7%Stage 3 – 0% |
| Death, n (%) | 4 (36%) | 4 (31%) |
Median serum concentration of CI group at 24-hour was 23.59μg/mL [14.52–28.97], while of II group at 23-hour was 12.30μg/mL [7.27–18.12] and at 25-hour was 17.58μg/mL [12.5–22.5]. Thus, median serum concentrations of II group one hour after vancomycin third dose were lower than those of CI group at 24-hour, and steady state was reached faster on CI group. However, there were no significant differences on vancomycin serum levels between both infusion groups at 48-hours [CI 18.28μg/mL (10.6–27.125) vs. II 19.10μg/mL (10.25–20.5).
In this study, pharmacokinetic parameters of II versus CI vancomycin therapy for critical ill patients admitted to intensive care units were assessed. Moreover, serum level curves of 11 CI patients and 12 II patients were compared. The median serum concentrations on II group one hour after vancomycin third dose were lower than those of CI group at 24-hour and steady state was probably reached faster on CI group. However, there were no significant differences on vancomycin serum levels between both infusion groups at 48-hours, since at this time steady state had already been reached on both groups.
Difference between first 24-hour vancomycin concentrations (II vs. CI) is important when considering treating severe ICU patients. Critical patients with renal failure may be spared from toxicity due more predictable vancomycin AUC and benefitted from CI premature steady state attainment when compared with II. Nevertheless, patients’ outcomes did not differ between infusion regimens.15–17 Cataldo et al. 2011 compared both infusion regimens and found similar mortality rates (CI vs. II), however, with minor renal impairment rate to CI group. There has been concern about vancomycin nephrotoxicity since its approval and when used concomitantly with other drugs potentially nephrotoxic drugs, such as aminoglycosides, amphotericin, and acyclovir. Additionally, the combination of vancomycin and piperacillin-tazobactam can result in augmented nephrotoxicity compared to vancomycin alone.18–20 Toxicities during vancomycin therapy with concomitant aminoglycosides are shown in Table 2.
Divergence on Pk target concentration of vancomycin CI is presented on literature. Cristallini et al. considered values from 20 to 30μg/mL while Sin et al. proposed 15–25μg/mL.8,21 The target concentration according our hospital TDM protocol was 15–25μg/mL. Middle-income regions may not afford the new IDSA recommendations of Bayesian software programs to guide vancomycin treatment. However, given the importance to optimize TDM, CI may be a cheaper option once it does not require expensive softwares, but only two measures within 24h to establish the AUC in a given patient.
This study has several limitations. Few patients were included and patients with renal failure were excluded. However, there is a lack of data on vancomycin CI administration and its pharmacokinetic parameters, which are essentials to real effectiveness and sparing patients from toxicities.
Vancomycin CI reached steady state earlier, which guaranteed therapeutic levels from the first day and made it possible to manage therapeutic drug monitoring faster. This practice may reduce nephrotoxicity risk and assure both treatment efficacy and safety.
AuthorshipAll authors meet the ICMJE authorship criteria.
Conflicts of interestFelipe F. Tuon is a CNPq researcher.
Financial supportNone.


