

After more than a year since the novel coronavirus (SARS-CoV-2) disease 2019 or COVID-19 has reached the status of a global pandemic, the number of COVID-19 cases continues to rise in Brazil. As no effective treatment been approved yet, only mass vaccination can stop the spread of SARS-CoV-2 and end the COVID-19 pandemic. Multiple COVID-19 vaccine candidates are under development and some are currently in use. This study aims to describe the characteristics of individuals who have registered in an online platform to participate in clinical trials for COVID-19 vaccines. Additionally, participants’ characteristics according to age and presence of comorbidities associated with severe COVID-19 and differences of SARS-CoV-2 testing across different geographical areas/neighborhoods are provided. This was a cross-sectional web-based study conducted between September and December/2020, aiming to reach individuals aged ≥18 years who live in Rio de Janeiro metropolitan area, Brazil. Among 21,210 individuals who completed the survey, 20,587 (97.1%) were willing to participate in clinical trials for COVID-19 vaccines. Among those willing to participate, 57.8% individuals were aged 18–59 years and had no comorbidity, 33.7% were aged 18–59 years and had at least one comorbidity, and 8.6% were aged ≥ 60 years regardless the presence of any comorbidity. Almost half (42.6%) reported ever testing for COVID-19, and this proportion was lower among those aged ≥ 60 years (p < 0.001). Prevalence of positive PCR results was 16.0%, higher among those aged 18–59 years (p < 0.009). Prevalence of positive antibody result was 10.0%, with no difference across age and comorbidity groups. Participants from areas/neighborhoods with higher Human Development Index (HDI) reported ever testing for SARS-CoV-2 more frequently than those from lower HDI areas. Interest to participate in clinical trials for COVID-19 vaccines candidates in Rio de Janeiro was significantly high. The online registry successfully reached out a large number of individuals with diverse sociodemographic, economic and clinical backgrounds.
The novel coronavirus (SARS-CoV-2) disease 2019, or COVID-19, is currently the largest and most challenging public health crisis worldwide, having reached the status of a global pandemic since March 11, 2020.1 After more than a year, the number of cases of COVID-19 continues to rise in Brazil. From February 26, 2020 to August 10, 2021 there have been 20,212,642 confirmed cases and more than 564,000 deaths in the country. The Southeast region, which includes the Rio de Janeiro State, accounted for 38% of all COVID-19 cases in Brazil. Rio de Janeiro State confirmed 1,063,772 cases, holding the lowest incidence rate per 100,000 inhabitants, but the highest mortality rate in the region (348.3 deaths/100,000 inhabitants).2
Since the onset of the pandemic, social distancing and community containment measures to avoid the spread of COVID-19 and the collapse of the health system have been poorly and unequally adopted in the country.3 During May 2021, only 30% of Brazilians reported being isolated at home, the lowest rate since the onset of the pandemic.4 Despite the major importance of such measures, low income Brazilians struggle to adhere to social distancing measures due to financial constraints.5,6 Brazil is the 9th largest economy by nominal Gross Domestic Product (GDP = US$ 1.9 trillion), but the 9th most unequal country in the world.7 Brazilian geographic regions have impressive disparities in terms of GDP and Human Development Index (HDI), and these disparities are dramatic when analyzed within cities and metropolitan areas. Rio de Janeiro metropolitan area is the second largest in the country and the 16th of the world, accounting for more than 13 million inhabitants and 22 municipalities. Huge socioeconomic disparities are widespread in the region, in which HDI varies from very high to low in adjacent neighborhoods.8 These inequalities in wealth and health care closely impact health outcomes,9 including hospitalizations and deaths related to COVID-19.10
Mass vaccination campaigns to prevent or respond to outbreaks of vaccine-preventable diseases are effective strategies to reduce the number of cases and deaths.11 With no effective treatment currently approved, only mass vaccination may stop the spread of SARS-CoV-2 and end COVID-19 pandemic. By May 2021, four COVID-19 vaccines have been registred or approved for emmergency use by the Brazilian Health Regulatory Agency (ANVISA). The ChAdOx1 nCoV-19,12 developed by AstraZeneca/Oxford and produced by Bio-Manguinhos, Fundação Oswaldo Cruz (Fiocruz),13 and the BNT162b2,14 produced by Pfizer, Inc. and BioNTech have been registred.15 CoronaVac,16 developed by Sinovac Life Science Co. Ltd. and produced by Instituto Butantan,17 and Ad26.COV2.S, developed and produced by Janssen Vaccines & Prevention B.V18 have been approved for the emmergency use only. From January 17, 2021 to August 10, 2021, 109,208,435 Brazilians have received at least one dose of COVID-19 vaccine and 46,902,420 were fully vaccinated, representing 22.1% of the country's population.19
Additional COVID-19 vaccine candidates are under development and some will get to clinical development soon.20 Due to the high prevalence of COVID-19 in Brazil, clinical trials may be developed in the country and research centers should be structured and prepared to conduct these trials. Instituto Nacional de Infectologia Evandro Chagas (INI)-Fiocruz, located in Rio de Janeiro, Brazil, is a centennial institution fully dedicated to research, prevention and care of infectious diseases, including HIV, tuberculosis, Zika, Dengue, and hepatitis, with a long path of conducting large clinical trials.21 With the advent of the COVID 19 pandemic, the Institute has fully embraced the mission of providing high level care and research on this new deadly disease.
This study aims to describe the characteristics of individuals living in Rio de Janeiro metropolitan area who have registered in an online platform to participate in clinical trials for COVID-19 vaccines candidates to be conducted at INI-Fiocruz. Additionally, we compare participants’ characteristics according to age and presence of comorbidities associated with severe COVID-19 and provide differences of SARS-CoV-2 testing across different areas/neighborhoods of the area.
Material and methodsStudy designThis was a cross-sectional web-based study, in which participants were invited to complete an online questionnaire and provide personal information such as name, mobile phone number and e-mail, to be potentially contacted by INI-Fiocruz team for COVID-19 vaccines clinical trials. Eligibility criteria were age ≥18 years and residence in Rio de Janeiro metropolitan area. Individuals were excluded from this analysis if they had previously completed the questionnaire (same mobile phone number), did not inform neighborhood of domicile, reported being pregnant, or reported no interest to participate in clinical trials for COVID-19 vaccines.
The online questionnaire was programmed on Alchemer®. The researchers piloted the questionnaire before starting the study. The survey was open (not password-protected). Mobile version of the survey had one question per page, and number of pages depended on the chosen answers (adaptative questioning). All survey items had a non-response option (“I don't want to answer”). CHERRIES statement for web-based survey was followed.22
The survey was launched on September 10, 2020. On September 23, 2020 it was advertised on INI-Fiocruz (https://www.ini.fiocruz.br/) and Fiocruz webpages (https://portal.fiocruz.br/noticia/fiocruz-cadastra-voluntarios-para-participar-de-estudo-de-vacina-para-prevencao-da-covid-19). We also implemented community advertisement in low income areas of Rio de Janeiro city (INI-Fiocruz neighbor communities and West region) using posters, banners and flyers with telephone number, WhatsApp contact and QR code, which directed individuals to the survey link. We identified micro influencers at these regions, who performed lectures and meetings to explain the importance of COVID-19 vaccines. To increase the percentage of answers among individuals aged 55+ years, we posted advertisements on Facebook from November 18 to 23, 2020 targeting this population. We closed the survey link and stopped recruitment on December 07, 2020.
The INI-Fiocruz institutional review board (#CAAE 36868820.9.0000.5262) reviewed and approved this study. All participants acknowledged reading the informed consent text and provided digital consent. No incentives were provided in accordance with Brazilian regulations.
Survey instrumentThe survey instrument was composed of six sections (33 questions) addressing: sociodemographic, daily activities, comorbidities, and SARS-CoV-2 testing.
VariablesSociodemographicVariables were age at the time of the survey; gender identity (cisgender men, cisgender women or transgender/non-binary); region (city and neighborhood); race/color (Asian, Black, Indigenous, Pardo, White, and “I don't know”); schooling (according to Brazilian educational levels, from elementary incomplete to graduation); and number of people living at home (alone, 1, 2, 3, 4, or ≥5).
Daily activitiesParticipants were inquired about current daily activities such as: receiving visits at home, which included people in charge of services, such as cleaning (never, rarely, monthly, weekly, or daily), and working (yes, retired, unemployed, or license). Those reporting current work were asked about frequency of commuting to work (never, once a week, 2 to 4 times a week or 5, or more times a week). Those commuting to work at least once a week answered questions about means of transportation to work and use of personnel protective equipment (PPE) such as face mask by coworkers (yes, no, or I don't know). In addition, we inquired about participation in public events with 10+ people in the last two weeks (yes, no, or I don't know).
Associated factors with severe COVID-19Participants were asked about current or past comorbidities or conditions that are associated with severe COVID-19 disease from a pre-determined list: any cardiovascular disease (e.g. heart failure, coronary artery disease, congenital heart disease, cardiomyopathies, and pulmonary hypertension), sleep apnea, arthritis, asthma or bronchitis, stroke (ischemic, hemorrhagic, or intracranial), cancer, neurological conditions, diabetes (type I or II), chronic liver disease (e.g. steatosis, cirrhosis, chronic hepatitis B), chronic kidney disease (requires hemodialysis or peritoneal dialysis), COPD (chronic obstructive pulmonary disease or pulmonary emphysema), pulmonary fibrosis or cystic fibrosis, systemic arterial hypertension, HIV, obesity (body mass index [BMI] ≥ 30), thalassemia or sickle cell anemia, active or treated tuberculosis (TB), and organ transplantation. Number of comorbidities was categorized into none, one, two, and three or more. Participants also provided information on tobacco/e-cigarette smoking (never, former, or current smoker).
SARS-CoV-2 testing and resultsParticipants were asked if ever tested for SARS-CoV-2 (yes/no). For those who ansewered positively, we asked which was the test (PCR [polymerase chain reaction] or antibody tests) and their results (positive, negative, inconclusive, or pending).
Statistical analysisSociodemographic characteristics, daily activities and SARS-CoV-2 testing were described for the entire sample and stratified into three mutually exclusive groups depending on the risk of severe COVID-19 disease (18–59 years with no comorbidity, 18–59 years with at least one comorbidity, ≥ 60 years regardless of comorbidities). Number and type of comorbidities were described according to age (< 60 years vs. ≥ 60 years). We compared SARS-CoV-2 testing and results as well as comorbidities among the three groups using chi-square test. Ever testing for SARS-CoV-2, PCR and antibody test results were described according to metropolitan area municipalities23 and Rio de Janeiro city administrative region (33 regions)24,25 classified according to HDI.26 Analyses were performed using Software R version 4.0.3.27
ResultsA total of 35,374 individuals accessed the questionnaire; 4197 (11.9%) on the day of advertisement was launched at Fiocruz website (23-Sep-2020), and 16,121 (45.6%) during the following seven days (24 to 30-Sep-2020). Among 21,210 individuals who completed the survey, only 623 (2.9%) reported no interest to participate in clinical trials for COVID-19 vaccines; the remaining 20,587 individuals (97.1%) were included in this analysis (Fig. A).

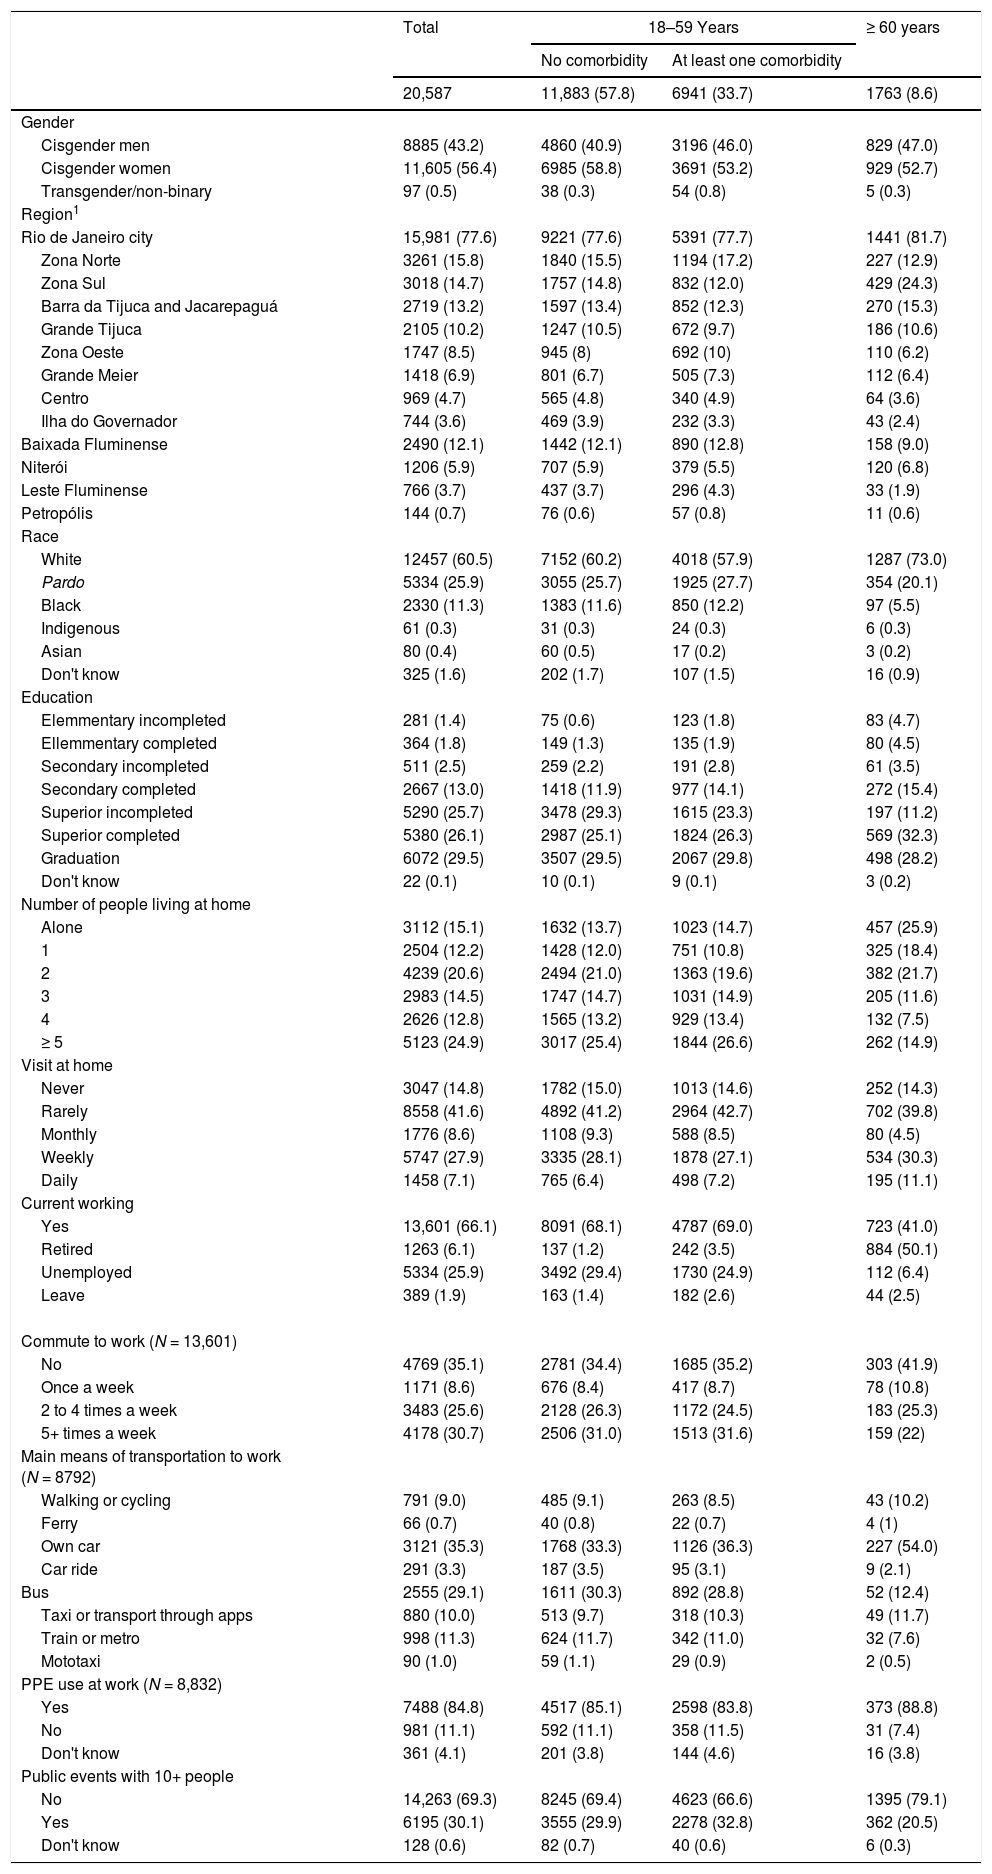
Median age was 36 years (interquartile range [IQR]: 26–47) and 1763 (8.6%) were aged ≥ 60 years. More than half were cisgender women (56.4%), 12,457 (60.5%) were white, 11,452 (55.6%) reported completed college education or higher, 5123 (24.9%) reported living with 5+ persons and only 3047 (14.8%) were not receiving visits at home (Table 1). Of all respondents, 30.1% attended a public event with 10 or more people in the previous two weeks. A total of 5334 (25.9%) were unemployed and 13,601 (66.1%) were currently working; 64.9% (8,832/13,601) reported commuting to work, and 41.1% (3,619/8,792) were using bus, train, metro or ferry as the main means of transportation. The majority reported use of PPE at work (84.8%; 7488/8,832).
Sociodemographic and daily activities characteristics of study population stratified by age and commorbidity. Rio de Janeiro, Brazil, 2020.
1: Rio de Janeiro city 33 administrative regions were grouped into: Zona Norte (Ramos, Penha, Inhaúma, Irajá, Madureira, Anchieta, Pavuna, Jacarezinho, Complexo do Alemão, Maré, Vigário Geral), Zona Sul (Botafogo, Copacabana, Lagoa, Rocinha), Barra da Tijuca and Jacarepaguá (Jacarepaguá, Barra da Tijuca, Cidade de Deus), Grande Tijuca (Tijuca, Vila Isabel), Zona Oeste (Bangu, Campo Grande, Santa Cruz, Guaratiba, Realengo), Grande Méier, Centro (Zona Portuária, Centro, Rio Comprido, Santa teresa, São Cristóvão, Ilha de Paquetá), Ilha do Governador. Other municipalities of metropolitan area in: Baixada Fluminense (Duque de Caxias, Guapimirim, Itaguaí, Japeri, Magé, Mesquita, Nilópolis, Nova Iguaçu, Paracambi, Seropédica); Niterói; Leste Fluminense (Cachoeiras de Macacu, Itaboraí, Maricá, Rio Bonito, São Gonçalo, Tanguá); Petropólis. PPE: Personal Protection Equipment.
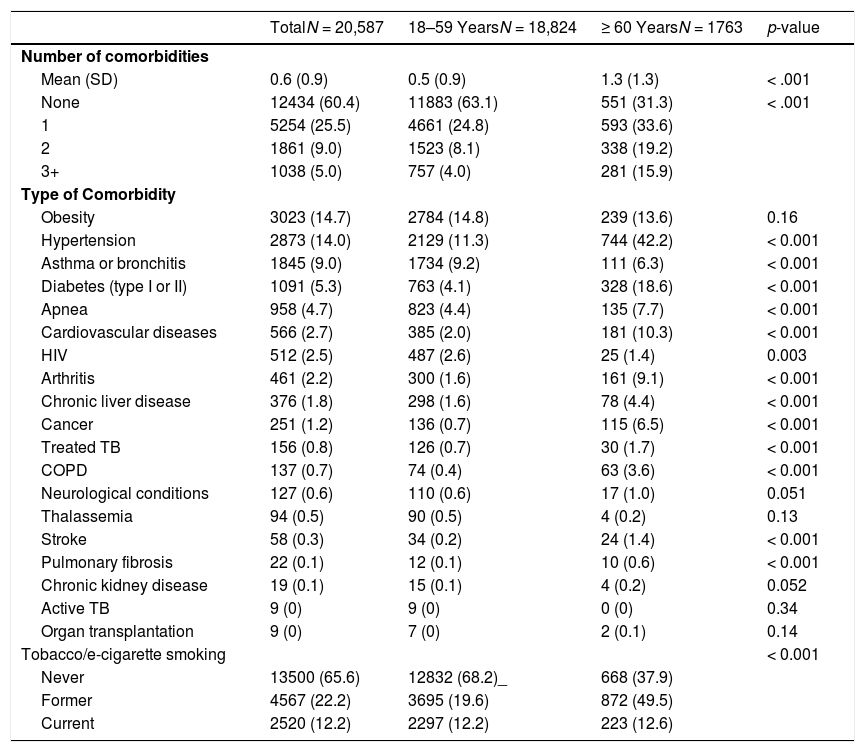
Overall, 8153 (39.6%) reported at least one comorbidity and 1038 (5.0%) reported three or more comorbidities (Table 2). Only 551 (31.3%) participants aged ≥ 60 years reported no comorbidity, and among this age group, 281 (15.9%) reported three or more comorbidities (p < .001). Overall, the most frequent comorbidities were obesity (14.7%), hypertension (14.0%), and asthma (9.0%). Among participants aged ≥ 60 years, the most frequent were hypertension (42.2%), diabetes (18.6%), and obesity (13.6%). Only 2520 (12.2%) of the respondents reported being a current smoker and 4567 (22.2%) were former smokers.
Factors associated with the risk of developing severe COVID-19 (self-reported) among study participants according to age. Rio de Janeiro, Brazil, 2020.
SD: standard deviation; TB: tuberculosis; COPD: chronic obstructive pulmonary disease.
Considering the three mutually exclusive groups, 11,883 (57.8%) were aged 18-59 years and reported no comorbidity, 6941 (33.7%) were aged 18–59 years and with at least one reported comorbidity, and 1763 (8.6%) were aged ≥ 60 years regardless of any comorbidity. Comparing these three groups, we noted that participants aged ≥ 60 years (N = 1763) were more likely to live in Rio de Janeiro city (including the most developed areas, such as Zona Sul), to be White, to have completed superior education or higher and to live alone; they were less likely to be currently working, to commute to work and to attend public events with 10 people or more. Comparing the two groups of participants aged 18–59 years, those with at least one comorbidity were more likely to be Pardo or Black, to have lower education (complete secondary education or lower), to be current or former smokers, and less likely to attend public events with 10+ people.
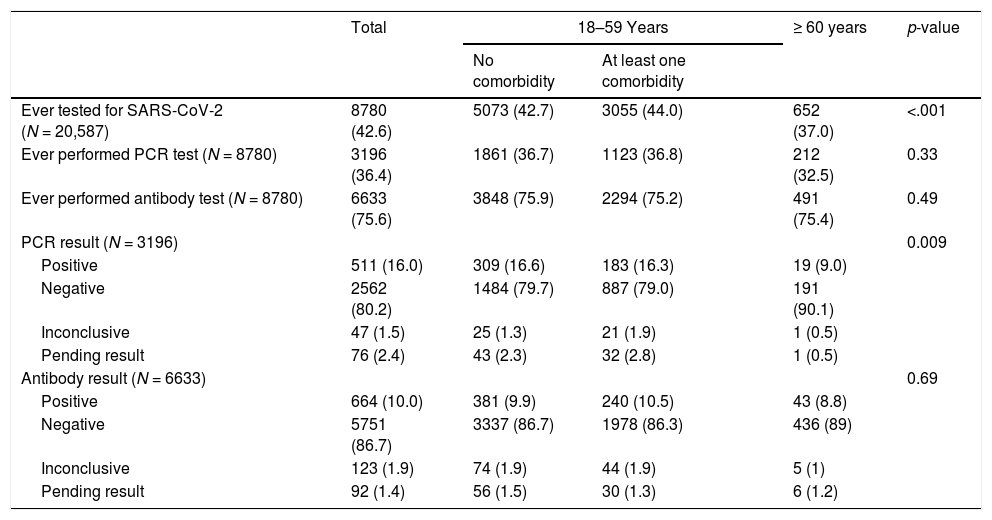
A total of 8,780 (42.6%) participants reported ever testing for SARS-CoV-2; the proportion was lower among those aged ≥ 60 years (p < 0.001) (Table 3). Most of them reported a previous antibody test (75.6%) and 36.4% reported a previous PCR test. Among individuals reporting a prior SARS-CoV-2 serology, prevalence of a positive result was 10.0%, with no difference across groups. Of those reporting prior PCR, prevalence of a positive result was 16.0%, higher among individuals aged 18–59 years compared to the those aged ≥ 60 years (p < .009).
Self-reported SARS-CoV-2 testing and results among study participants, Rio de Janeiro, Brazil, 2020.
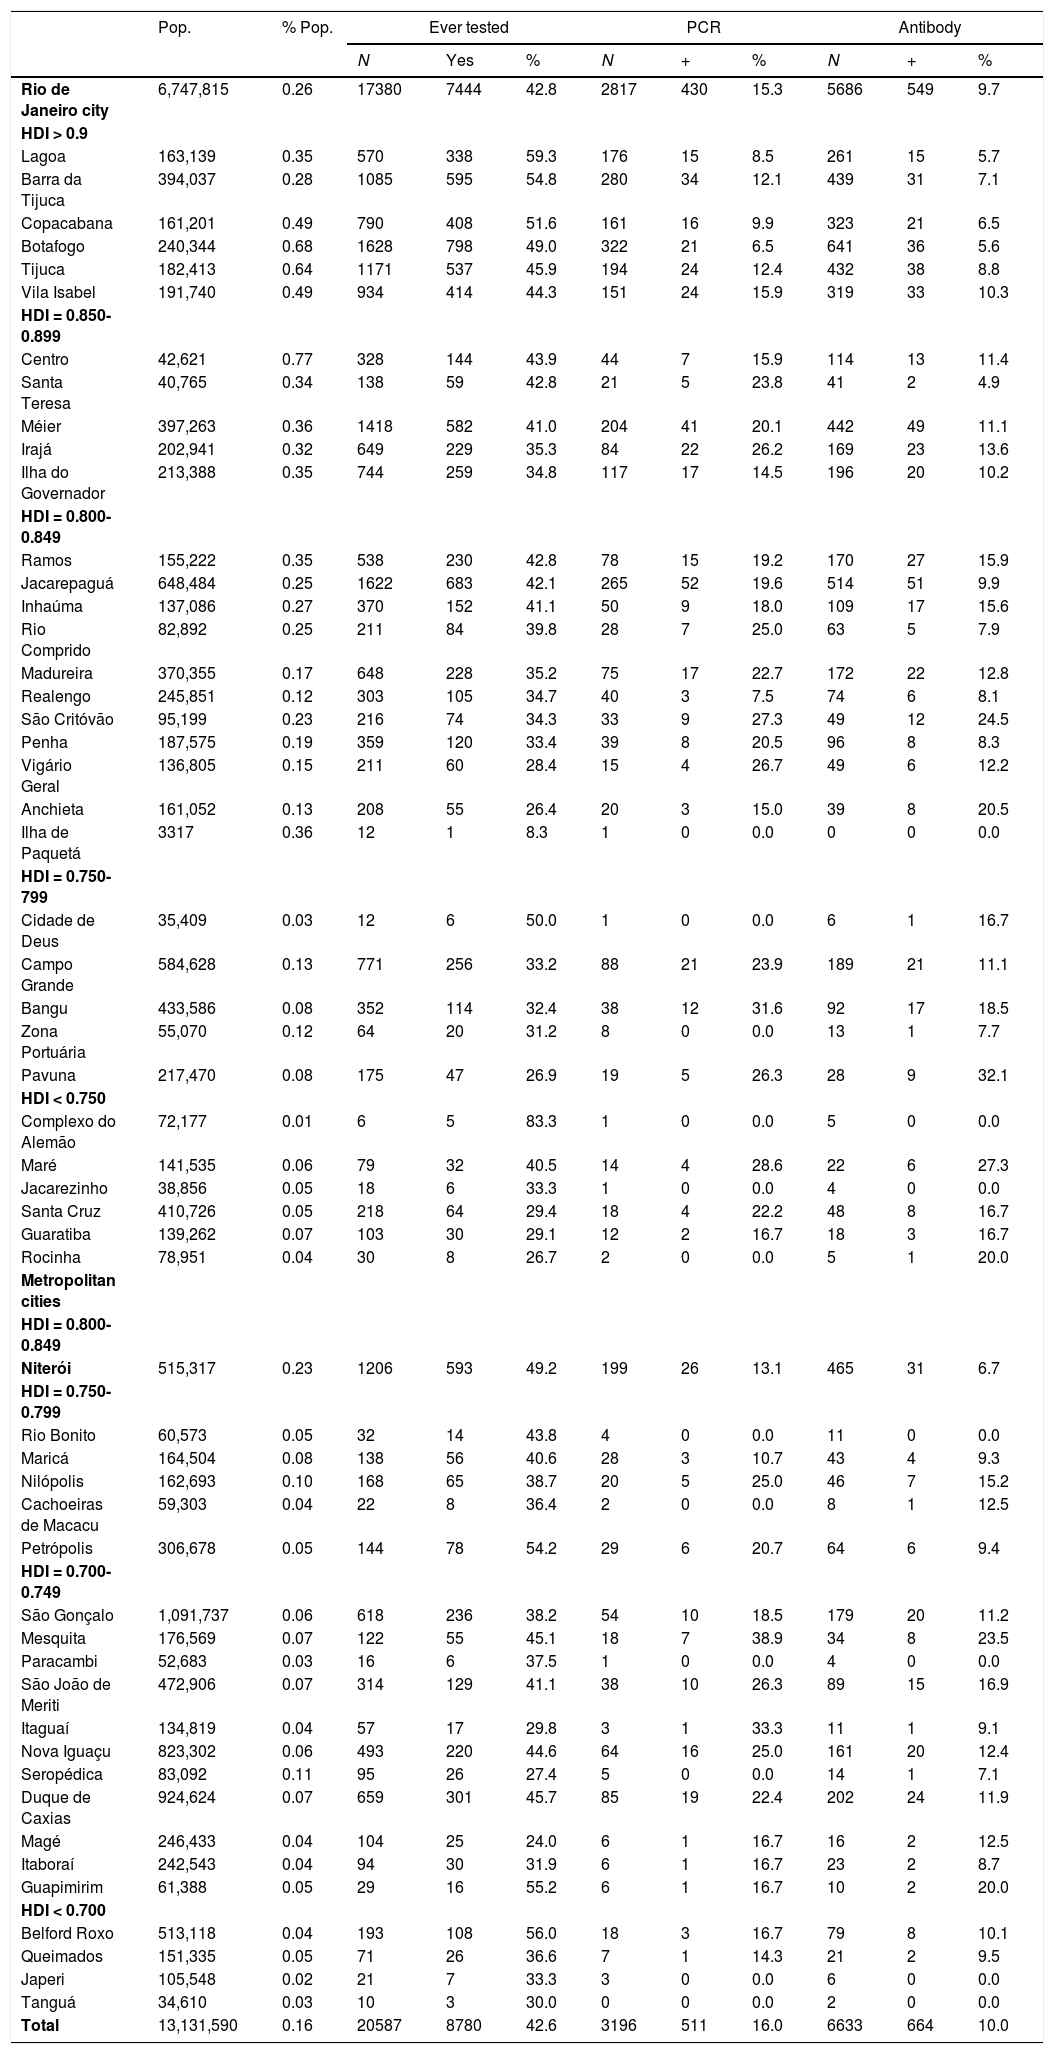
Dividing the number of participants by the population estimates of each city of the Rio de Janeiro metropolitan area, residents from Rio de Janeiro city (0.26%) and Niterói (0.23%) were more frequently represented in the study sample. Within the municipality of Rio de Janeiro, residents of administrative regions with higher HDI were more frequently represented (Table 4). Respondents from higher HDI areas reported SARS-CoV-2 testing more often (>50%) than those from lower HDI areas (29%) (Table 4). Self-reported overall SARS-CoV-2 prevalence (positive PCR or antibody tests) varied across regions. Among the areas with >30 volunteers, prevalence of SARS-CoV-2 by PCR was highest in areas with lower HDI.
Self-reported SARS-CoV-2 testing and results among study participants according to municipality and Rio de Janeiro administrative area. Rio de Janeiro, Brazil, 2020.
1Estimated population of each city and region in 2020.
2%pop: percentage of individuals who tested for SARS-CoV-2 considering the estimated population of each city and region in 2020. HDI: Human Development Index.
We have effectively reached out to a large and diverse population of individuals living in Rio de Janeiro metropolitan area through online and community recruitment strategies, indicating the willingness of the Brazilian population to register for participating in COVID 19 vaccine studies. In addition, we observed disparities in SARS-CoV-2 testing throughout different geographic regions in Rio de Janeiro metropolitan area, which may be a proxy of health disparities, including access to health services.
This study included a high proportion of white, more educated individuals from high HDI areas. However, it is worth noticing that most of the participants were unable to strictly comply to social distancing measures, therefore posing themselves at risk for SARS-CoV-2 infection. Most participants received visits at home, needed to commute to work and used public transportation (buses, trains, metro). Social distancing measures have been irregularly adopted in Brazil since the beginning of the COVID-19 epidemic.3,6 By opposing economy and health, the Brazilian government strategy has been to try to achieve herd immunity through contagion.28 The economic crisis in the country, which had already impacted the social achievements obtained until 2013, gained a greater negative momentum in 2020 with the COVID-19 pandemic.29 Our group has already described an association between socioeconomic/racial disparities and unattainability in maintaining social distancing among sexual and gender minorities.6 Brazilian Government's response to the pandemic has been marked by controversy about social distancing policies,3 but these policies should be considered, implemented and maintained while the population is being vaccinated.
Our findings indicate that older individuals (aged ≥ 60 years) were less exposed to COVID-19 in terms of social distancing and performed less SARS-CoV-2 tests than individuals aged 18–59 years. Among the later group, participants with comorbidities were less exposed to COVID-19 and more frequently tested for SARS-CoV-2. This is in accordance with a previous study conducted in Rio Grande Sul, Brazil,30 and is relevant, as older individuals and persons with comorbidities are more likely to develop severe COVID-19 and death.31 Conversely, results from a recent study showed that Brazilian individuals who are male, older, with lower education levels, and living in less developed regions had lower knowledge about COVID-19,32 which may expose them to increased risk of infection.
Less than half (42.6%) of participants reported ever testing for SARS-CoV-2. SARS-CoV-2 prevalence according to self-reported PCR and antibody positive test results were 16.0% and 10.0%, respectively. These results indicate that individuals somehow affected by COVID-19 pandemic may be more interested in COVID-19 vaccines, as SARS-CoV-2 testing is more frequently performed by individuals who are symptomatic or have more severe illnesses.33 SARS-CoV-2 antibody prevalence in Rio de Janeiro city was estimated at 2.4% [95% confidence interval – 95% CI: 0.7-5.6] during May 14–21, 2020 and 7.5% [95% CI: 4.5–11.7] during June 4–7, 2020.34 Increase in antibody prevalence was expected as our study was conducted some months after the last assessment (from September to December 2020). Nevertheless, our results should be analyzed with caution as we collected self-reported data and diagnostic methods and results may be overestimated.
This study observed disparities in SARS-CoV-2 testing across different regions of Rio de Janeiro metropolitan area. Overall, more individuals from higher HDI areas reported ever being tested for SARS-CoV-2, indicating disparities in access to health care, as tests are not widely available at the Brazilian Public Health System (SUS) and focus on symptomatic individuals. Individuals living in higher HDI areas may have access to tests through private laboratories and clinics (less prone to shortage in testing). Despite universal susceptibility to COVID-19, populations with increased social vulnerability in Brazil are more and unequally affected by COVID-19,35 indicating that policies to prioritize low income individuals need to be considered and urgently implemented.
Important considerations about the online registry should be noted. Fiocruz website has shown to be highly effective for recruitment, indicating population trust in scientific research conducted by this centenary institution and its importance in providing scientific information. Our study population mostly comprised individuals aged 18–59 years, despite our efforts to increase recruitment of older individuals through social media advertisements. Community activities were important to increase recruitment of individuals from lower HDI areas, although the majority of individuals recruited were from higher HDI areas. Even though internet access has increased in Brazil among all social strata,36 structural social factors such as access to education may have prevented individuals from lower HDI areas to access and complete the questionnaire.
Although this study was performed in a single geographic location and included only individuals willing to participate in clinical trials for COVID-19 vaccines, some characteristics of our sample were similar to the general population, suggesting that our results may have external validity. Prevalence of comorbidities such as hypertension (13.3%), diabetes (5.3%), cardiovascular diseases (2.6%) and cancer (1.0%) were similar to those estimated in the most recent national survey (data collected in November 2020)37 and the prevalence of tobacco smoking was similar to national data from 2019 (12.6%).38 Moreover, we present data from a large sample of over 20,000 participants living in a large, diverse metropolitan area in Brazil, which indicates socioeconomic disparities in access to health care.
This study has limitations. First, web-based studies are not probabilistic sampling strategies, precluding the generalization of the findings to all individuals living in Rio de Janeiro metropolitan area or other metropolitan areas or regions in Brazil. Moreover, our findings are based on those who have access to mobile phones and internet connection. Nevertheless, recent data show that 79% of Brazilians have access to internet connection36 and 85% have mobile phones.39 All collected data were self-reported by participants and may be subject to bias, although individuals tend to be more honest through web-based surveys, reducing social desirability bias.40 Information on social distancing and mobility may be subject to recall bias or social expectation bias, so these results may be overestimated.
In conclusion, interest to participate in COVID-19 vaccines clinical trials in Rio de Janeiro metropolitan area, Brazil was very high. A large number of individuals with diverse sociodemographic, economic and clinical backgrounds were successfully registered for potential participation in clinical trials through an online platform. Our procedures to register participants interested on clinical trials for COVID-19 vaccines could be useful to other research centers in Brazil or in other countries to recruit individuals to clinical trials in general, not only to COVID-19 vaccine trials.
TST acknowledges funding from the National Council of Technological (CNPq, #28/2018). BG acknowledges funding from the National Council of Technological and Scientific Development and the Research Funding Agency of the State of Rio de Janeiro (Programa Cientista do Nosso Estado; Edital N.° 03/2018).
