


In the current standard of care (SoC) RT-PCR method for COVID-19, the patient's swab was extracted in viral transport media (VTM). For the Panbio™ COVID-19 Ag Rapid Test, the patient swab is flushed out in extraction buffer, of which a small fraction is used for testing, leaving more than half the sample unused. This study was designed to show that RT-PCR results from the residual sample of the Panbio™ COVID-19 Ag Rapid Test (called Novel RT-PCR) are not worse than the SoC RT-PCR result.
MethodsThe study was performed using (1) dilution series of five patient samples, and (2) 413 patient samples comparing SOC versus Novel RT-PCR results.
ResultsFor the dilution series samples, all tested positive by both methods. The bias between Ct values of Novel RT-PCR and SoC RT-PCR did not exceed 3.00 Ct using primers N1 and N2. A total of 413 COVID symptomatic patients seeking COVID testing were tested, of which 89 patients tested positive and 324 tested negative with SoC RT-PCR. In 324 patients who tested negative with SoC RT-PCR, 323 tested negative with Novel RT-PCR, and one (1) tested positive. Out of 89 who tested positive with SoC RT-PCR, 80 tested positive with the Novel RT-PCR, and nine patients showed a negative test result. The Overall Percent Agreement for the 413 valid patient sample pairs was 97.5 [95% CI 97 to 98].
ConclusionThe study demonstrated that the performance of the Novel RT-PCR method is acceptable compared to the SoC RT-PCR method and can be a useful tool to perform RT-PCR without the need for new swab collections.
Virological testing plays a critical role in the global response to the SARS-CoV-2 pandemic.1–3 Early diagnosis allows infectious cases to be isolated in a timely manner curbing viral transmission. In addition, early diagnosis and initiation of appropriate supportive therapy can improve outcomes and prevent mortality.4–7 The majority of well-resourced countries have implemented large scale nucleic acid tests (NATs) for COVID-19 diagnosis. NATs have the benefit of high sensitivity and specificity for current or recent infection. However, these tests are challenging to implement in large scale in resource-poor settings due to cost, lack of good specimen transport systems and lack of both laboratory infrastructure and highly trained technicians. The turnaround time for NAT results can also be an issue and it is common for results to be reported 1-2 weeks after specimen collection.8,9 This means that patient management decisions often need to be made in the absence of any test result. On the other hand when RT-PCR test results return to health provider the more infectious phase of patients, between 2-3 days after symptom onset, has passed.
The emergence of new antigen-detection rapid diagnostic tests (Ag-RDTs) may help to address some of these challenges, and the World Health Organization (WHO) has recently published draft Target Product Profiles for such tests.10 These tests which detect SARS-CoV-2 proteins (antigens) to diagnose active infection are low-cost, relatively easy to use, and can be conducted within minutes to hours at the point of care without need of a laboratory. The Panbio™ COVID-19 Ag Rapid Test device is a lateral flow immunochromatographic test on the Panbio™ COVID-19 Ag platform, intended as an aid to diagnose COVID-19 disease in patients infected by SARS-CoV-2 virus and can use tissue fluids obtained from nasal or nasopharyngeal swabs. The product may be used in laboratory and non-laboratory environments that meet the requirements specified in the product's Instructions for Use (IFU).
The aim of this study was to develop a method to perform RT-PCR using leftover samples from the Panbio™ COVID-19 Ag Rapid test and to demonstrate performance equivalence to the current standard of care (SoC) RT-PCR method. To establish this method (hereafter referred to as the “novel” method), dilutions of high titer specimens were tested by both the SoC and novel RT-PCR methods and evaluated by comparing the obtained cycle threshold (Ct) values. Once the method was established, performance of the novel method was evaluated against the SoC method across a wide range of patients’ specimens.
MethodsComparing performance of SoC RT-PCR against novel RT-PCR using dilutions of high titer samplesFive high titer patients’ samples (Ct values ranging from 10 to 20) identified at UFRJ COVID Diagnostic Center were used. The samples were tested in either seven (two samples) or eight (three samples) dilutions: 1:1, 1:2, 1:4, 1:8, 1:16, 1:32, 1:64 and 1:128. For the SoC RT-PCR method, Noble Bio nylon flocked swabs were soaked in each of the respective dilutions, then immediately extracted into 2 ml VTM and shipped to the laboratory where PCR was performed and 200 µl of the sample were used for RT-PCR.
For the Novel RT-PCR method, Noble Bio nylon flocked swabs were soaked in each of the respective dilutions, then immediately placed into 300 µl kit buffer in the Panbio™ COVID-19 Ag Test, Abbott (Chicago, USA) extraction tube, then removed five drops per the IFU and set aside at 4°C, and the remaining sample was shipped to the Reference Laboratory located at Molecular Virology Laboratory at Biology Institute, UFRJ within 4 h. In the Reference Laboratory, the Panbio™ COVID-19 Ag Test extraction tube was flushed with 500 µl VTM, and 200 µl µl was used for RT-PCR. This study has been evaluated and approved by UFRJ Ethics Review Board under # 30161620.0.0000.5257.
RNA extraction and RT-PCRRNA extraction was performed using the Maxwell® 16 Viral Total Nucleic Acid Purification Kit from Promega, (Madison, USA), per the manufacturer's instructions. RT-PCR was performed using the CDC protocol using N1, N2 and RP primers/probes provided by IDT (Iowa, USA).11 In brief, each reaction tube contained 5 µl RNA template, 1.5 µl primer time CDC kit from IDT, 0.4 µl GoScript™ RT Mix for 1-Step RT-qPCR, 10 µl GoTaq® Probe qPCR Master Mix with dUTP and 3.1 µl Nuclease-Free Water in a 20 µl total reaction volume from Thermofisher (USA). Thermal cycling conditions were (1) RT incubation (50 °C for 30 min, 1 cycle), (2) enzyme activation (95 °C for 10 min, 1 cycle), and (3) amplification (95 °C for 30 s and 58 °C for 60 s, 45 cycles). The RT-qPCR assay provided a Ct value, which is the number of cycles necessary for the fluorescent signal to cross the threshold. Limit of detection of the assay was established using serial dilution of plasmid target provided by IDT containing 200,000 copies/ µl of the SARS-Cov2 N gene. For each sample, three targets were evaluated (N1, N2 and RP) and: a) a sample was considered positive for the novel coronavirus if both N1 and N2 had a Ct value of up to 37; b) a sample was considered negative for the novel coronavirus if one or both N1 or N2 had an undetectable result or a Ct value above 40; c) in all other cases, the result was considered inconclusive.
Comparing performance of SoC RT-PCR against Novel RT-PCR using patient samplesTwo nasopharyngeal (NP) swabs were collected from each subject from whom informed consent was obtained. Subjects from all age groups having COVID-19 suggestive symptoms for less than seven days were enrolled. The first NP swab collected was placed in 2 ml VTM immediately following collection and sent to the Reference Laboratory for SoC testing. The second NP swab was immediately used for Panbio™ testing.
The extraction tubes containing the leftover NP samples from the Panbio™ test (∼120 µl) were shipped to the RT-PCR testing lab. The tubes were uncapped inside a Class 2B2 laminar flow hood and 500 µl VTM was added, after which the tubes were closed and mixed by tapping. The mixture of 120 µl sample and 500 µl VTM produced the same approximate concentration of viral particles as is in the 2 ml sample volume used for SoC testing. After mixing, the lower cap of the extraction tube was removed and the entire tube content were collected in a 1.5 ml Eppendorf tube, of which 200 µl was used for RNA extraction and this RNA was used directly in the RT-PCR standard protocol.
Evaluation of data and statistical methodsData analysis was performed considering qualitative (positive/negative) as well as semi-quantitative results (Ct values). Positive, negative and overall percent agreement with 95% Clopper-Pearson confidence intervals between Novel and SoC RT-PCR were estimated. Deming regression was performed for comparison of Ct values between Novel and SoC RT-PCR. Note: Dependence between the same dilution series of the same samples were not modeled.
ResultsAnalysis of VTM diluted samplesDilutions of five patients were tested in either seven (two patient samples) or eight dilutions (three patient samples). In sum, results for 38 samples tested with SoC RT-PCR as well as with Novel RT-PCR were available. All 38 samples were tested positive with both methods. Thus, both methods show the same qualitative results.
The scatter plot in Fig. 1 presents the 38 results obtained with SoC RT-PCR on the x-axis and with Novel RT-PCR on the y-axis. Results show coverage of SoC RT-PCR from 21.27 Ct to 34.70 Ct.
 and Novel RT-PCR (y-axis) for one sample. Colors represent the IDs of the five patients. The solid line represents the Deming regression line with the 90% confidence interval of the bias between both methods (shaded area). The dashed lines represent the identity line and interval of ± 3 Ct around it. This Ct interval is considered as acceptable.")
Deming regression fit for VTM diluted samples for both targets in RT-PCR N1 and N2. Each dot shows Ct values for SoC RT-PCR (x-axis) and Novel RT-PCR (y-axis) for one sample. Colors represent the IDs of the five patients. The solid line represents the Deming regression line with the 90% confidence interval of the bias between both methods (shaded area). The dashed lines represent the identity line and interval of ± 3 Ct around it. This Ct interval is considered as acceptable.
The Bland-Altman plot in Fig. 2 shows the difference between both methods with the average of both methods on the x-axis. A visual inspection of this difference plot was performed to characterize the variability of differences and to identify and remove outliers, specimens showing differences > 2 SD. The Bland-Altman plot did not reveal any obvious patterns or drifts in the data. There was no dependency between magnitude of differences and Ct values. Therefore, constant standard deviation across the entire Ct value range is assumed.
 and Bias between Novel and SoC RT-PCR (y-axis) for one sample. Colors represent the IDs of the five patients. The red dashed lines represent the Mean difference ± 2 x Standard Deviation of differences between both methods.")
Bland-Altman Plot for VTM diluted samples for both RT-PCR targets N1 and N2. Each dot shows mean Ct values for Novel and SoC RT-PCR (x-axis) and Bias between Novel and SoC RT-PCR (y-axis) for one sample. Colors represent the IDs of the five patients. The red dashed lines represent the Mean difference ± 2 x Standard Deviation of differences between both methods.
The Novel RT-PCR generated higher mean Ct values when compared to the SoC RT-PCR. Under consideration of data from all 38 samples, the mean difference is 0.63 Ct for N1 target region and 1.61 Ct for N2 target region. Standard deviation (SD) of difference is 1.38 Ct for N1 target region and 1.24 for N2 target region. Two patient samples are outside the range of mean difference ± 2 x SD: Dilution 1:64 and 1:128 of patient sample 20030. Based on analysis of the dilution series, we did not assume that these two samples must be considered as outliers for example due to technical issues. As expected, Ct values for each patient, method and RT-PCR target region shows linear relationships to logarithmic dilution factors (see Fig. 3). This also holds for the two potential outlier dilutions 1:64 and 1:128 of patient sample 20030. It is assumed that these potential outliers arise from individual patient characteristics and thus were kept for further data analysis.
 and N2 (bottom), both methods (Novel RT-PCR red, SoC RT-PCR blue) and each patient sample, separately. Solid lines represent linear regression line for each patient, target, and method.")
The Deming regression method was applied to fit a regression line. Deming regression was performed using R package software. Fig. 1 presents the regression line fitted to data pairs. For the N1 target region, the slope of the regression line is 0.76 Ct [95%IC 0.66; 0.88] and the offset is 6.90 Ct [95%IC 3.93; 9.77]. For the N2 target region, the slope of the regression line is 0.87 Ct [95%IC 0.77; 1.00] and the offset is 5.13 Ct [95%IC 1.80; 7.99].
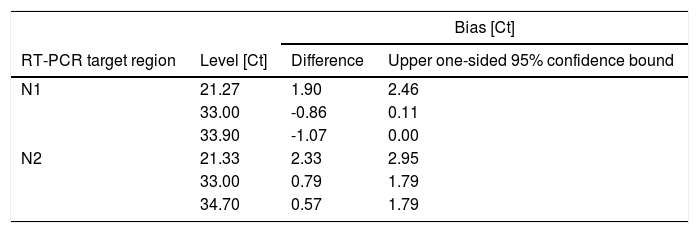
The bias is the difference between perfect agreement (i.e. identity line) and the effective agreement (fitted regression line) of both methods. Bias is reported for the borders of the covered Ct value range as well as for Ct 33.00 in Table 1 together with the corresponding upper one-sided 95% confidence bounds. Ct values around 33 are of particular relevance as Ct values >33 are reported to be not contagious.11
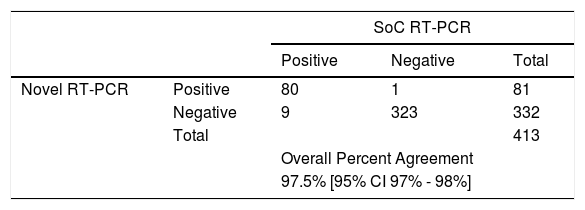
Evaluation of patient samplesA total of 413 patients were tested, of which 89 patients tested positive and 324 tested negative with SoC RT-PCR. In 324 patients tested negative with SoC RT-PCR, 323 tested negative with Novel RT-PCR, and one1 tested positive. Out of 89 who tested positive with SoC RT-PCR, 80 tested positive with the Novel RT-PCR, and nine patients showed a negative test result (see Table 2). The sensitivity of the RT-PCR run with Novel RT-PCR was 89.90% [95%CI 81.21% - 94.98%] and the specificity was 99.69% [95%CI 98.02% - 99.98%). The sensitivity increased to 97.18% when patients´ specimens with Ct< 25 in N1/N2 primers were analyzed. The overall agreement between the two specimens’ type was 97.5% [95% CI 97 – 98%].
The Bland-Altman plot in Fig. 4 shows the difference between both methods with the average of both methods on the x-axis. A visual inspection of this difference plot was performed to characterize the variability of differences and to screen for potential outliers. The Bland-Altman plot did not reveal any obvious patterns or drifts in the data. There is no dependency between magnitude of differences and Ct values. Therefore, constant standard deviation across the entire Ct value range is assumed.
 and N2 (b). Each dot shows mean Ct values for Novel and SoC RT-PCR (x-axis) and Bias between Novel and SoC RT-PCR (y-axis) for one patient sample. The red dashed lines represent the Mean difference ± 2 x Standard Deviation of differences between both methods.")
Bland-Altman Plot for patient samples for both targets in RT-PCR N1 (a) and N2 (b). Each dot shows mean Ct values for Novel and SoC RT-PCR (x-axis) and Bias between Novel and SoC RT-PCR (y-axis) for one patient sample. The red dashed lines represent the Mean difference ± 2 x Standard Deviation of differences between both methods.
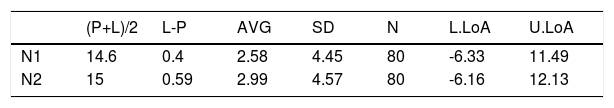
The Novel RT-PCR shows generated higher Ct values when compared to the SoC RT-PCR. This fact means that the amount of viral genetic material recovered Panbio™ COVID-19 Ag Rapid Test extraction buffer is lower when compared to quantity isolated from standard swab in Virus Transportation Media. Taking into consideration the data from all 80 patient samples, the mean difference was 2.58 and 2.99 Ct for the N1 and N2 target region, respectively. Standard deviation (SD) of difference was 4.45 and 4.57 Ct for the N1 and N2 target region, respectively. Six patient samples were outside the range of mean difference ± 2 x SD when N1 primers was analyzed and five5 for N2 primer counterpart (See Fig. 4 and Table 3 for details).
Bias between Novel RT-PCR(L) and SoC RT-PCR (P) results for patient samples.
| (P+L)/2 | L-P | AVG | SD | N | L.LoA | U.LoA | |
|---|---|---|---|---|---|---|---|
| N1 | 14.6 | 0.4 | 2.58 | 4.45 | 80 | -6.33 | 11.49 |
| N2 | 15 | 0.59 | 2.99 | 4.57 | 80 | -6.16 | 12.13 |
(P+L)/2 [Novel RT-PCR and SoC RT-PCR media]; L-P [difference between Novel RT-PCR and SoC RT-PCR]; AVG [Average]; SD [Standard Deviation]; N [number of patient analyzed]; L/U.LoA [Lower/Upper Limit of Agreement].
In the current standard of care (SoC) RT-PCR method, the patient's swab was extracted in viral transport media (VTM). For the Panbio™ COVID-19 Ag Rapid Test, the patient swab is flushed out in extraction buffer, of which only a small fraction is used for testing, leaving more than half the sample unused. This study was designed to show that RT-PCR results from the residual sample from the Panbio™ COVID-19 Ag Test (called Novel RT-PCR) are not worse than the SoC RT-PCR results. Overall Percent Agreement for the 413 valid patient sample pairs was 97.8% [95% CI 93.2% - 100.0%]. The bias between N1 and N2 primer Ct values of Novel RT-PCR and SoC RT-PCR did not exceed 3.00. In another experiment, VTM dilution series of five patients were utilized to check the agreement between the SoC and Novel RT-PCR. Overall, results of 38 VTM dilution series tested with SoC RT-PCR as well as with Novel RT-PCR were similar and samples were tested positive with both methods. The bias between Ct values of Novel RT-PCR and SoC RT-PCR did not exceed 3.00 Ct in the tested Ct value range (21.27 to 34.70 Ct). This range includes the Ct value up to 33 which is of particular relevance as Ct values >33 is reported to be not contagious.12
In summary, the study proved that the performance of the Novel RT-PCR method is acceptable compared to the SoC RT-PCR method. This new usage of leftover material from the Panbio™ COVID-19 Ag Rapid Test for RT-PCR will facilitate specimen collection for both tests (Ag RDT and RT-PCR) by avoiding multiple collection in patients seeking COVID-19 diagnosis. In a logical way, the Novel RT-PCR explained here can be used as a tie-breaker test when needed or for Ag RDT test quality control procedures.
Working group compositionThe UFRJ COVID-19 Working group is composed by: Cássia Cristina Alves Gonçalves1, Lídia T. Boullosa 1, Mariana Freire Campos2, Helena D'Anunciação de Oliveira3, Kissyla Harley Della Pascoa França 3, and Victor Akira Ota 4. 1 Department of Genetic, Institute of Biology, Federal University of Rio de Janeiro (UFRJ), Brazil; 2Biological Science Institute, Federal University of Rio de Janeiro (UFRJ), Brazil; 3Nursing School Ana Nery, Federal University of Rio de Janeiro (UFRJ), Brazil; 4School of Medicine, Federal University of Rio de Janeiro (UFRJ), Brazil.
The authors would like to acknowledge the support and advice provided by Dr. Luis Gonzalez Olivieri and Kerstin Scheubert who are both employees of Abbott Laboratories.
