


Our goal was to evaluate if traffic-light driven personalized care for COVID-19 was associated with improved survival in acute hospital settings.
MethodsDischarge outcomes were evaluated before and after prospective implementation of a real-time dashboard with feedback to ward-based clinicians. Thromboembolism categories were “medium-risk” (D-dimer >1000ng/mL or CRP >200mg/L); “high-risk” (D-dimer >3000ng/mL or CRP >250mg/L) or “suspected” (D-dimer >5000ng/mL). Cytokine storm risk was categorized by ferritin.
Results939/1039 COVID-19 positive patients (median age 67 years, 563/939 (60%) male) completed hospital encounters to death or discharge by 21st May 2020. Thromboembolism flag criteria were reached by 568/939 (60.5%), including 238/275 (86.6%) of the patients who died, and 330/664 (49.7%) of the patients who survived to discharge, p<0.0001. Cytokine storm flag criteria were reached by 212 (22.6%) of admissions, including 80/275 (29.1%) of the patients who died, and 132/664 (19.9%) of the patients who survived, p<0.0001. The maximum thromboembolism flag discriminated completed encounter mortality (no flag: 37/371 [9.97%] died; medium-risk: 68/239 [28.5%]; high-risk: 105/205 [51.2%]; and suspected thromboembolism: 65/124 [52.4%], p<0.0001). Flag criteria were reached by 535 consecutive COVID-19 positive patients whose hospital encounter completed before traffic-light introduction: 173/535 (32.3% [95% confidence intervals 28.0, 36.0]) died. For the 200 consecutive admissions after implementation of real-time traffic light flags, 46/200 (23.0% [95% confidence intervals 17.1, 28.9]) died, p=0.013. Adjusted for age and sex, the probability of death was 0.33 (95% confidence intervals 0.30, 0.37) before traffic light implementation, 0.22 (0.17, 0.27) after implementation, p<0.001. In subgroup analyses, older patients, males, and patients with hypertension (p≤0.01), and/or diabetes (p=0.05) derived the greatest benefit from admission under the traffic light system.
ConclusionPersonalized early interventions were associated with a 33% reduction in early mortality. We suggest benefit predominantly resulted from early triggers to review/enhance anticoagulation management, without exposing lower-risk patients to potential risks of full anticoagulation therapy.
Human infection due to the novel severe acute respiratory syndrome coronavirus 2 (SARS-CoV-2)1 (commonly referred to as COVID-19 disease) has had unprecedented global impact on society and healthcare provision. In the first seven months of 2020, there have been more than 600,000 fatalities, with three countries (USA, Brazil and UK) each reporting more than 40,000 deaths.2
Current management protocols have generally emerged from China, where risk factors for in-hospital death included older age, higher Sequential Organ Failure Assessment (SOFA) score, and D-dimer greater than 750ng/mL on admission.3 Cytokine patterns3–5 were recognized as compatible with a “cytokine storm” of dysregulated inflammation and hyperpyrexia.6–9 Adult respiratory distress syndrome (ARDS), acute kidney, cardiac and liver failure, and a cytokine storm driving later deteriorations have been foci of research and clinical initiatives, alongside development of vaccines and antiviral therapeutics.10 Autopsy studies11–14 provided a slightly different picture as the risk of fatal thromboembolic disease emerged, in keeping with the initial reports of elevated D-dimer associations.3 Thromboembolic disease is now estimated to affect high proportions of patients with COVID-19.15–18
COVID-19 displays heterogenous presentation patterns and outcomes. Patient comorbidities including hypertension, diabetes, obesity, and heart disease are associated with higher risk of severe COVID-19 disease.3,4,19–21 while patients with additional common diseases including asthma and chronic obstructive lung disease (COPD) are advised to take extra precautions in the USA.22 Reported COVID-19 inpatient mortality rates vary by city/region,23 between countries,1,3,4,16,17,19,23–25 and by disease severity.3,4,23–26 Differential survival rates can therefore reflect a multitude of confounders from patients, geography, and health care systems, superimposed on pathophysiological variability that is not yet understood.
A near real-time decision tool was introduced early in the pandemic in our institution, as we were concerned about the high published mortality rates. This tool refreshes in the background every 10min and updates a clinical dashboard accordingly. Generated on the electronic patient record, traffic lights were used to alert clinicians when patients met criteria for increased risk of the three most common causes of death in COVID-19 – thromboembolism, cytokine storm, and respiratory deterioration/ARDS.
The goal of the current study was to evaluate whether prospective application during April and May 2020 had been associated with any change in patient early mortality across completed hospital episodes.
Materials and methodsInstitution and detailsAll patients were consecutive admissions to the emergency department. A COVID-19 battery of tests was developed in electronic medical records and introduced into clinical practice in early March 2020. The COVID pathology order was requested for all patients admitted to the emergency department with suspected and or confirmed COVID-19 infection, and subsequently requested by physicians throughout patients’ stay to monitor trends and adjust treatments accordingly. This standardized COVID-19 careset spanned complete blood count (CBC); coagulation including prothrombin time, activated partial thromboplastin time (APTT), fibrinogen, and D-dimer; electrolytes (sodium, potassium); renal function (urea, creatinine); liver function (bilirubin, alkaline phosphatase, albumin, aspartate transaminase, alanine transaminase, gamma-glutamyltransferase (GGT), lactate dehydrogenase (LDH); iron studies (serum iron, transferrin saturation index, ferritin), and additional acute phase response markers including C-reactive protein (CRP).
Traffic light systemA near real-time decision support tool was developed and set up on each electronic patient record.27 This was created for use with COVID-19 patients in March 2020 (Supplementary material 1). In initial stages of the COVID-19 pandemic, a composite of variables which included first vital signs and the COVID-19 battery of test results on admission to the emergency department was used to model the disease. In brief, our clinical dataset was passed through a Neural Network algorithm contained in SQL Server Analysis Services (SSAS) Data Mining Package. The input variables were age; sex; first recorded systolic blood pressure (BP); first recorded diastolic BP; first recorded respiratory rate; first recorded temperature; first recorded oxygen saturation (SpO2); first recorded fractional inspired oxygen concentration (FiO2); first recorded heart rate, and first recorded c-reactive protein (CRP). We rapidly learnt that the CRP showed highly predictive value when patients presented with D-dimer <3000ng/mL. In view of the lack of randomized controlled trial data, and post-mortem communications predating references11–14 the authors felt it was prudent to include the minimal D-dimer cut off of 750ng/mL published by Chinese colleagues at the end of January 2020.3 For simplicity the value was rounded to 1000ng/mL.
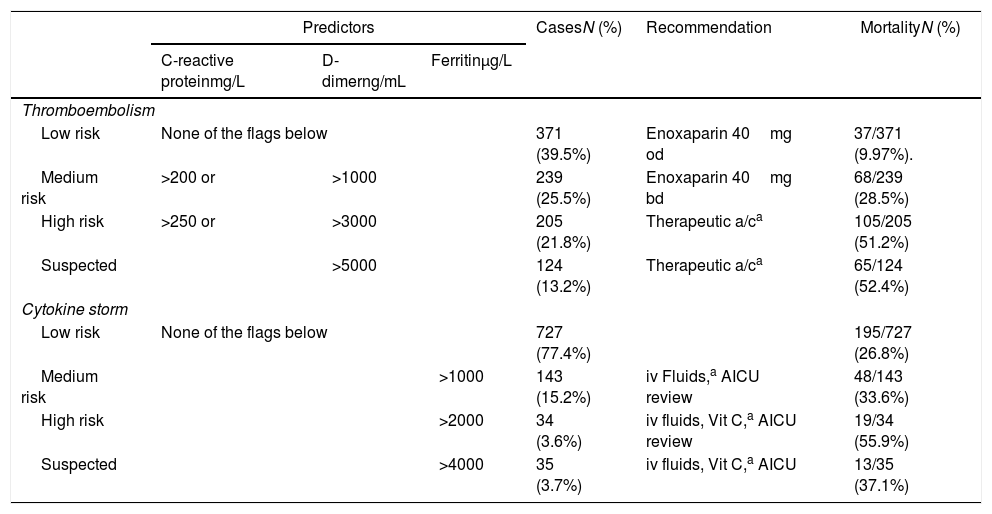
Between 20th March 2020 and 12th April 2020, a daily report was issued on all COVID-19 positive patients in the institution, and sent to an experienced critical care clinician for review. Results were interpreted and fed back to the clinical teams to review, and modify pathways as appropriate, with data from the first phase defining patterns of disease and biomarkers. There were recommended anticoagulation protocols and guidelines for management of cytokine storm (Table 1) which the treating physician adopted and tailored to patient's response to treatment when indicated.
Traffic light diagnostic flags and overall outcomes.
| Predictors | CasesN (%) | Recommendation | MortalityN (%) | |||
|---|---|---|---|---|---|---|
| C-reactive proteinmg/L | D-dimerng/mL | Ferritinμg/L | ||||
| Thromboembolism | ||||||
| Low risk | None of the flags below | 371 (39.5%) | Enoxaparin 40mg od | 37/371 (9.97%). | ||
| Medium risk | >200 or | >1000 | 239 (25.5%) | Enoxaparin 40mg bd | 68/239 (28.5%) | |
| High risk | >250 or | >3000 | 205 (21.8%) | Therapeutic a/ca | 105/205 (51.2%) | |
| Suspected | >5000 | 124 (13.2%) | Therapeutic a/ca | 65/124 (52.4%) | ||
| Cytokine storm | ||||||
| Low risk | None of the flags below | 727 (77.4%) | 195/727 (26.8%) | |||
| Medium risk | >1000 | 143 (15.2%) | iv Fluids,a AICU review | 48/143 (33.6%) | ||
| High risk | >2000 | 34 (3.6%) | iv fluids, Vit C,a AICU review | 19/34 (55.9%) | ||
| Suspected | >4000 | 35 (3.7%) | iv fluids, Vit C,a AICU | 13/35 (37.1%) | ||
Therapeutic a/c, therapeutic anticoagulation unless contraindications; Vit C, ascorbic acid 1g bd; iv fluids, fluid management adjusted to replace insensible losses (1mlkg−1h−1 for every degree above 38°C). If there was no response to initial fluid management and diastolic blood pressure remained <35mmHg, or oxygen requirement increased, then the patients were referred to the AICU for further management.
The traffic light system went live across the full institution on 12th April 2020, updated every 10min, for implementation into prospective pathways by all clinicians. Clinicians were also updated by whatsApps, emails, and phone calls, following electronic medical record monitoring of prescription compliance on a regular basis. The most effective way of communication was by utilization of whatsApps groups with updates of the institutional hematology guidelines. The date of introduction (12th April 2020) was used to cohort patients in the study, as described further below.
EthicsData processing was authorized by the Clinical Information Governance committees. Access to the data and authorization for the present study was jointly granted by both the Institution's Data Protection Office and by the Institution's Analytical Unit, under the General Data Processing Regulations (processing under public authority for purposes in the area of public health). To ensure compliance with General Data Protection Regulations, data were extracted from pseudonymized datasets into aggregate reports only for the outcomes of interest. The corresponding author had full access to all the data in the study and the final responsibility to submit for publication.
Cohort admission categorizationsThe study cohort represented all COVID-19 positive patients who had completed their hospital encounter by 21st May 2020. Patients were either discharged home alive (including to temporary homes and/or residential care homes), or had died. At the date of reporting, patients who remained in the admitting hospital, or had been transferred to other hospitals, were considered to have an “incomplete” encounter and were not included in the analysis.
Patients with completed encounters were categorized into three cohorts, according to timing in relation to 12th April 2020 when the traffic light system went live across the full institution. The “Pre” cohort completed their hospital encounter (to home discharge or death) before 12th April 2020. The “Post” cohort were admitted on or after 12th April 2020, so their admission was fully managed by the real-time system. A third group was admitted before, but discharged after 12th April 2020 (the “Bridge” cohort).
The comorbidities of asthma, COPD, diabetes, and hypertension were defined where listed as a Diagnosis or Problem on the electronic patient record or historic coding. A prior pharmacy record of salbutamol prescription also placed patients in the asthma category, and a requested glycated hemoglobin (HbA1c) level placed patients in the diabetic category. Patients could have one, several or none of the comorbidities.
Data analysesAnonymized data were analyzed using Stata IC version 15 (Statacorp, Texas) across the full cohort and across all time periods. Comparisons were performed using the non-parametric Kruskal–Wallis equality-of-populations rank test, with Dunn's multiple comparison test used to derive the multiple comparison-adjusted, two-tailed p-values. To adjust for differences in age, sex and other variables between the time periods, multivariate logistic regression was performed for the binary outcome of death (‘1′) versus home discharge (‘0′). The probabilities of death in the “Pre” and “Post” cohorts were calculated by post-test marginal comparisons after logistic regression across the full 939 cases using model covariates of age, sex and a 3-cohort variable distinguishing the “Pre”, “Bridge” and “Post” cohorts. For illustration of summary statistics and heat maps, data were exported to Graph Pad Prism 8.1.1 for Windows (GraphPad Software, San Diego, California USA).
CalculationIt is already known that COVID-19 causes severe mortality, particularly in patients requiring invasive ventilatory support, developing a cytokine storm, or experiencing thromboembolic disease. There is little evidence on whether to institute preventative measures, (and if so, in which subpopulations of COVID-19 infected patients), or whether to wait for patients to develop end-stage disease.
We hypothesized that:
- (1)
blood test results in dynamic reassessments would discriminate patients at or becoming at higher risk of complications;
- (2)
if rapidly communicated to clinicians, higher risk patients could be targeted for early review and implementation of accelerated enhanced treatments;
- (3)
early implementation of accelerated enhanced treatments, targeted at individual level at the point of entry, would translate to improved outcome demonstrated by more patients surviving to be discharged home alive.
A total of 1039 COVID-positive patients had been admitted by 21st May 2020. Of those, 889 (85.6%) were managed on general wards, and 150/1039 (14.4%) were admitted to adult intensive care for part of their inpatient stay. Of the 1039 patients, 664 had been discharged home, either to their usual residence (n=614), a temporary home (n=16), or a residential care home (n=34), and 275 had died. A further 100 patients were still in the hospital, or of unknown outcome following transfer to a different hospital.
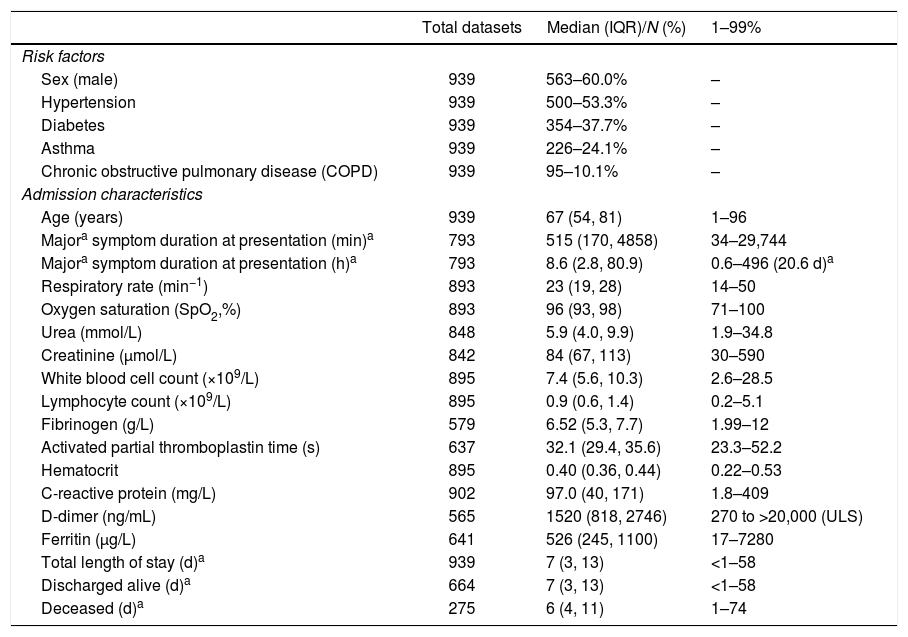
The 939/1039 who had completed their hospital encounter by 21st May 2020 constituted the current study cohort. Patients’ median age was 67 years (interquartile range, IQR 54–81 years) i.e. more than 25% of admitted patients were at least 81 years old, and 563/939 (60%) were males. The population comprised 62% white (370/597 recorded), and 38% black and minority ethnic (227/597 recorded). Comorbidities were common: 500/939 (53%) patients were hypertensive; 354/939 (38%) were in the diabetic category, 226/939 (24%) were defined as having asthma, and 95/939 (10%) with COPD (Table 2).
Cohort Characteristics.
| Total datasets | Median (IQR)/N (%) | 1–99% | |
|---|---|---|---|
| Risk factors | |||
| Sex (male) | 939 | 563–60.0% | – |
| Hypertension | 939 | 500–53.3% | – |
| Diabetes | 939 | 354–37.7% | – |
| Asthma | 939 | 226–24.1% | – |
| Chronic obstructive pulmonary disease (COPD) | 939 | 95–10.1% | – |
| Admission characteristics | |||
| Age (years) | 939 | 67 (54, 81) | 1–96 |
| Majora symptom duration at presentation (min)a | 793 | 515 (170, 4858) | 34–29,744 |
| Majora symptom duration at presentation (h)a | 793 | 8.6 (2.8, 80.9) | 0.6–496 (20.6 d)a |
| Respiratory rate (min−1) | 893 | 23 (19, 28) | 14–50 |
| Oxygen saturation (SpO2,%) | 893 | 96 (93, 98) | 71–100 |
| Urea (mmol/L) | 848 | 5.9 (4.0, 9.9) | 1.9–34.8 |
| Creatinine (μmol/L) | 842 | 84 (67, 113) | 30–590 |
| White blood cell count (×109/L) | 895 | 7.4 (5.6, 10.3) | 2.6–28.5 |
| Lymphocyte count (×109/L) | 895 | 0.9 (0.6, 1.4) | 0.2–5.1 |
| Fibrinogen (g/L) | 579 | 6.52 (5.3, 7.7) | 1.99–12 |
| Activated partial thromboplastin time (s) | 637 | 32.1 (29.4, 35.6) | 23.3–52.2 |
| Hematocrit | 895 | 0.40 (0.36, 0.44) | 0.22–0.53 |
| C-reactive protein (mg/L) | 902 | 97.0 (40, 171) | 1.8–409 |
| D-dimer (ng/mL) | 565 | 1520 (818, 2746) | 270 to >20,000 (ULS) |
| Ferritin (μg/L) | 641 | 526 (245, 1100) | 17–7280 |
| Total length of stay (d)a | 939 | 7 (3, 13) | <1–58 |
| Discharged alive (d)a | 664 | 7 (3, 13) | <1–58 |
| Deceased (d)a | 275 | 6 (4, 11) | 1–74 |
Of the 939 COVID-positive patients in the cohort, 371 (39.5%) patients had no thromboembolism flag (D-dimer values were ≤1000ng/mL, and CRP values ≤200mg/L) For 239/939 (25.5%) the highest thromboembolism category reached was a “medium risk” flag (D-dimer between 1001 and 3000ng/mL, or a CRP between 201 and 250mg/L). 329/939 (35.0%) received a flag for higher risk – 205/939 (21.8%) the “high risk” thromboembolism flag (D-dimer between 3001–5000ng/mL or CRP >250mg/L) and 124/939 (13.2%) the “suspected thromboembolism” flag (D-dimer >5000ng/mL).
Across all patients’ completed encounters to discharge home or death, mortality was lowest in the patients who received no thromboembolism flag (37/371, 9.97%). Mortality was intermediate in those with the “medium-risk” flag (68/239, 28.5%), and highest in the patients with the high-risk flag (105/205, 51.2%), or suspected thromboembolism (65/124, 52.4%) (Fig. 1).
 Thromboembolism. (B) Cytokine storm. Numbers within the bars indicate the total number of the 939 patients who reached the category as their maximum flag for the category type. p-values were calculated for each category across all 939 patients using the Kruskal–Wallis equality-of-populations rank test, with Dunn")
Mortality for 939 completed encounters to death or home discharge based on traffic light category. (A) Thromboembolism. (B) Cytokine storm. Numbers within the bars indicate the total number of the 939 patients who reached the category as their maximum flag for the category type. p-values were calculated for each category across all 939 patients using the Kruskal–Wallis equality-of-populations rank test, with Dunn's test multiple comparison-adjusted p-values presented.
For cytokine storm, 727/939 (77.4%) patients did not receive a flag during their admission. For 143/939 (15.2%) the highest cytokine storm category reached was a “medium-risk” flag, 34/939 (3.6%) received a “high-risk” flag, and 35 (3.7%) were flagged with “suspected” cytokine storm. Mortality differed overall between the four categories (Kruskal Wallis p<0.0001), predominantly attributable to higher mortality in the 69 patients who were flagged in the two higher risk categories (Fig. 1).
Categorization by traffic light real-time applicationOf the 939 patients with a completed encounter, 535 (57%) were in the “Pre” cohort admitted and discharged or died before/on 12th April 2020. 204 (22%) patients were in the “Bridge” cohort, and 200 (21%) were in the “Post” cohort admitted and discharged or died after 12th April 2020 (Supplementary Table A.1).
The median age of the “Pre” cohort was 67 years (IQR 52–80). The median age of the “Post” cohort was 72 years (IQR 56, 82.5), p=0.037 (means and 95% confidence intervals displayed in Fig. 2A). In crude analyses, 173/535 patients in the “Pre” cohort died (32.3% [95% confidence interval 28.0–36.0]), compared to 46/200 patients in the “Post” cohort (23.0% [95% confidence interval 17.1–28.9]), Dunn's test p=0.013 (Fig. 2B). An intermediate mortality was observed in the 204 patients whose admission spanned real-time traffic light introduction on 12th April 2020 – of these, 56/204 died (Fig. 2B). This was not significantly different to that of the "Pre" or "Post" cohorts (Dunn's test p-values 0.39 and 0.65, respectively).
 Age (years), (B) Survival (percentage), categorized by admission and discharge dates in relation to 12th April 2020 when the traffic light system went live across the full institution.")
Age and survival to discharge alive in the 939 COVID-19 positive patients. Mean and 95% confidence intervals indicated for (A) Age (years), (B) Survival (percentage), categorized by admission and discharge dates in relation to 12th April 2020 when the traffic light system went live across the full institution.
Full comparisons of the cohorts are provided in Supplementary Table A.2. Trends for the “Post” cohort to have higher proportions flagged at medium-risk (p=0.27) or high-risk (p=0.23) of thromboembolism did not reach statistical significance, though a higher proportion of the “Post” cohort were flagged with “suspected” thromboembolism compared to the “Pre” cohort (p=0.019, Fig. 3A–C). There was no difference between the “Pre” and “Post” subgroups in the smaller proportions with medium-risk (p=0.67), high-risk (p=0.96) or suspected (p=0.86) cytokine storm flags (Fig. 3D–F).
 Medium-risk thromboembolism; (B) High-risk thromboembolism; (C) Suspected thromboembolism; (D) Medium-risk cytokine storm; (E) High-risk cytokine storm; and (F) Suspected cytokine storm.")
Proportions of the 939 COVID-19 positive patients with thromboembolism or cytokine storm flags. Mean and 95% confidence intervals indicated for (A) Medium-risk thromboembolism; (B) High-risk thromboembolism; (C) Suspected thromboembolism; (D) Medium-risk cytokine storm; (E) High-risk cytokine storm; and (F) Suspected cytokine storm.
In logistic regression analyses, adjusted odds ratios for mortality were smaller (i.e. more favorable) than the crude odds ratio for the “Post” cohort following adjustment for age, sex, and all combinations of variables in Table 1 (data not shown).
Across all 939 patients, and adjusted for age and sex, the probability of death was 0.33 (95% confidence intervals 0.30–0.37) in the “Pre” cohort, and 0.22 (95% confidence intervals 0.17–0.27) in the “Post” cohort, p<0.001 (Fig. 4).
 across all 939 patients, using model covariates of age, sex and a 3-cohort variable defining patients in the “Pre”, “Bridge” and “Post” cohorts. The overall model of the 939 patients had a pseudo r2 of 12.2 and p-value <0.0001.")
Probability of Death in “Pre” and “Post” Traffic Light cohorts. Illustration of the post-test marginal comparison of “Pre” and “Post” cohorts after logistic regression of death (versus discharge) across all 939 patients, using model covariates of age, sex and a 3-cohort variable defining patients in the “Pre”, “Bridge” and “Post” cohorts. The overall model of the 939 patients had a pseudo r2 of 12.2 and p-value <0.0001.
Death-rates across the three time periods were examined for key patient subgroups. Compared to the “Pre” cohort, death rates were lower in the “Post” cohort for males (p=0.0014), for patients in the upper three age quartiles and above (≥54 years, p=0.0014), particularly the third age quartile (68–79 years, p=0.0014); for patients with hypertension (p=0.0072), and for patients with diabetes (p=0.05) (Fig. 5).
 to red (50% chance of survival/50% risk of death). The total number of patients per row (n) is indicated to the right of the heat map. The heatmap stars (*) indicate adjusted p-value calculated for each category using the Kruskal–Wallis equality-of-populations rank test, with Dunn")
Heat map for proportion of patients discharged alive or died, by subcategories. Colors range from green (100% survival/zero risk of death) to red (50% chance of survival/50% risk of death). The total number of patients per row (n) is indicated to the right of the heat map. The heatmap stars (*) indicate adjusted p-value calculated for each category using the Kruskal–Wallis equality-of-populations rank test, with Dunn's multiple comparison test used to derive the multiple comparison-adjusted p values for the “Pre” versus “Post” comparison * p≤0.05; ** p≤0.01; and *** p≤0.005.
We have shown that early introduction of near real time traffic light-driven, personalized care was associated with an overall reduction in crude mortality from 32.3% (95% confidence interval 28.0, 36.0), to 23.0% (95% confidence interval 17.1, 28.9). The overall age and sex-adjusted probability of mortality reduced from 0.33 (95% confidence intervals 0.30, 0.37), to 0.22 (95% confidence interval 0.17, 0.27), p<0.001. This was despite the later cohort including more patients with thromboembolism flags associated with poorer survival. The greatest benefits were observed in older patients, males, and in patients with hypertension (p-values ≤0.01) and/or diabetes (p=0.05). Taken together, these data suggest that the early clinical interventions modified progression of COVID-19 induced disease, and reduced the proportion of patients progressing to critical illness and death.
There were several study limitations with many shared by other studies in emergency-based assessments of this new human disease with very high mortality. Interventions prioritized clinical care delivery, and the main purpose of this manuscript was to stratify the disease and introduce early medical management, rather than detailed expositions of population characteristics and symptomatology. Patients with very prolonged hospitalization did not have completed encounters and were not included: responses in this important subgroup will need evaluation in future prospective randomized controlled trials. Additionally, capturing mortality to end-of-hospital admission may have missed subsequent deaths in the community, and these may have differed in proportions over the study period. However, for crude mortality in the “Post” cohort to reach that of the “Pre” cohort, an 86% mortality rate would be required in the inpatients admitted on/after 12th April 2020, when their current length of stay IQR already exceeds the IQR for length of stay before death (Supplementary Table A.1). Therefore, this reduction in early mortality is considered to be robust, and important to communicate.
The study was conducted at a two-site institution, therefore it is difficult to compare baseline mortalities with other institutions. Lower baseline mortality was reported for 2569 completed episodes in a different health care setting in New York, where 665/2569 (25.9%) patients died, though highlighting the potential problems of comparing different outcomes in different institutions, the New York cohort24 were ∼6 years younger, and their interquartile range (IQR) for D-dimer did not overlap with the current cohort (New York IQR 237–714ng/mL, current cohort 818–2746ng/mL).
With the very high worldwide mortality2 and strong steers toward risk factors from the earliest reports from China,1,3 it was not considered appropriate to randomize patients. Where lethality is high, as in COVID-19, the paucity of sequential analysis techniques has been noted with concern.28 The current study employed a sequential analysis technique, within a dual center, single institution, and demonstrated that the introduction of full traffic light-driven care on 12th April 2020 was associated with a 33% reduction in age and sex-adjusted inpatient mortality. We recognize that a limitation of a sequential analysis is that it is not possible to fully standardize variables, and acknowledge that other factors could have contributed. It is feasible that in the current study, the baseline “Pre” group were already benefiting from the first phase of traffic light implementation,27 and different approaches to care.29 The survival signal was robust to age and sex adjustment; adjustment for patient severity indices would have made the association stronger, and other major treatment protocols did not change in the study period. Clinical expertise and pathways did have extra time to embed, though we note unchanged mortality figures in major country-wide audits over the same period.30 It is therefore difficult to conclude that any other factor could have been responsible for generating a completed encounter inpatient mortality rate that at 23.0% [95% confidence intervals 17.1, 28.9] is now lower than in New York,24 and lower than the rates reported during the Middle East Respiratory Syndrome (MERS) epidemic.31 Further, this completed encounter mortality rate was achieved with more than 25% of the patient population aged 81 years or over at the time of admission, and with advanced disease at presentation as indicated by the interquartile ranges for admission CRP (40–171mg/L), admission D-dimer (818–2746ng/mL) and admission ferritin (245–1100μg/L).
Despite more severe disease in the “Bridge” cohort, survival rate was no worse than for the “Pre” cohort. This suggests that the “Bridge” cohort may have also benefitted in the first phase of traffic-light implementation.27
Numerically, the key differences compared to our initial practice were earlier, enhanced anticoagulation for patients identified as at higher risk of thromboembolism disease. A smaller group of patients flagged at risk of cytokine storm based on serum ferritin also had enhanced attention to fluid balance and intravenous fluid delivery. For thrombosis, the flags helped to identify the stratified risk, and the intervention was based on the risk regardless of the radiological findings. In COVID-19, thrombosis is commonly microvascular and difficult to detect using current imaging, with clinical reports tending to focus on the presence or absence of major thrombus. The observed benefit from enhanced anticoagulation is in keeping with the limited published evidence in COVID-19.26,32 The prothrombotic COVID-19 state is currently considered less to reflect disseminated intravascular coagulation (DIC) caused by the systemic generation of thrombin, than hypercoagulability in the setting of a severe inflammatory state,33 and particularly in situ thrombus formation.34–36 The findings would also be supported by previous evidence on multi-organ failure in sepsis where inhibiting thrombin generation by anticoagulation may have benefit in reducing mortality.37
There was early evidence that the presence of an elevated D-dimer was associated with a poor prognosis in COVID-19.3,38 It has been suggested that high D-dimer values may not reliably predict the presence of a thrombus that has been degraded by fibrinolysis, but instead represent a marker of poor overall outcome in COVID-19.39 However, data from the current study targeting D-dimer-identified subgroups, and from two other groups,26,32 indicate that enhanced anticoagulation can improve survival, in advance of full mechanistic understanding.
At the time of revised manuscript submission, there remain no data on where the risk of thromboembolism starts to rise on the scale of elevated D-dimer. Interpretation of the stepwise accrual of survival benefit with heparin treatment as D-dimer exceeded the upper limit of normal26 varies, as demonstrated by the six different classifications for high D-dimer used as inclusion criteria for COVID-19 anticoagulation studies listed on clinicaltrials.gov. Combining elevated D-dimer with other biomarkers has been proposed for thromboembolic risk stratifications in COVID-19 patients.40 As proposed in,40 we also examined fibrinogen initially, and unexpectedly found that CRP (which was not included in many Chinese reports),3,4 was more discriminatory. CRP and D-dimer not only identified higher risk categories for enhanced treatments, but also a low risk subgroup (all D-dimer ≤1000ng/mL, and all CRP ≤200mg/L). The ability to identify subgroups with better prognosis is generally helpful in establishing where risks of intensive therapies may be more difficult to justify. Since therapeutic anticoagulation carries hemorrhagic concerns, particularly for diseases with abnormal vasculature as in COVID-19,11–14,18 we speculate that restricting enhanced thromboembolic prophylaxis to patients in subgroups with higher thrombotic risks may have contributed to the overall favorable survival figures in the traffic lights-managed cohort.
In conclusion, early recognition of thromboembolism risk based on CRP and or D-dimer, and impending cytokine storm predominantly based on serum ferritin, enabled hospital survival for completed encounters of 77.0% (95% confidence intervals, 71.1–82.8%) when more than 25% of admitted patients were at least 81 years old. Many COVID-19 at-risk groups benefitted including older patients, males, and patients with concurrent hypertension and diabetes. The blood measurements are already part of most hospitals’ COVID-19 datasets, and interventions for thromboembolic disease, and fluid management are widely available and inexpensive. Thus broad application seems feasible, and wider implementation is encouraged.
Data sharing statementThe code and guidance is freely available on request from Alex.McCarthy@chelwest.nhs.uk, and is to be published to GitHub in due course. Fully anonymised data will be available post peer review publication on reasonable request, in accordance with institutional protocols above. A data dictionary defining each field in the data set will also be made available to others.
FundingThis research did not receive any specific grant from funding agencies in the public, commercial, or not-for-profit sectors. Support for clinical care was provided by Chelsea & Westminster Hospital NHS Foundation Trust, London, UK, and the National Health Service (NHS) in England.
Authors’ contributionThe study was conceived and overseen by MPV. Literature searches were performed by MPV, CLS, AM, AG, SP, and MH. The traffic light bioinformatics system was designed and implemented by MPV, AM, AH, and AB. The clinical study design was by MPV. Haematology care pathway design was by MPV, AG and SP. Data analysis for real-time feedback was performed by MPV and AM. Real time analytic data application was performed by MPV, AG, PS, AB, SC, PD, PL, SP, TP, MH, RTK, IB, and GD. Data analysis was devised and performed by CLS. Data interpretation was performed by MPV and CLS. Figures were generated by CLS. The manuscript was written by CLS, and revised by MPV, AM, SP, PLS, SC, and MH. All authors reviewed and approved the final manuscript..
Conflicts of interestThe authors declare no conflicts of interest.
AcknowledgmentsThe authors wish to thank the Chelsea & Westminster NHS Foundation Trust personnel and especially the Adult Intensive Care Unit nurses, for the delivery of personalised care to all patients admitted with COVID-19 infection. The authors would also wish to thank the CW Plus charity for invaluable support throughout the COVID-19 outbreak.
The following are the supplementary data to this article:
