
People living with HIV (PLH) under combined antiretroviral therapy (cART) are at risk of developing type 2 diabetes mellitus (T2DM).
ObjectiveWe examined the incidence of T2DM, associated factors and mean time to outcome in PLH under cART.
MethodData for this multicenter cohort study were obtained from PLH aged over 18, who started cART in 13 Brazilian sites from 2003 to 2013. Factors associated with incident T2DM were evaluated by Cox multiple regression models.
ResultsA total of 6724 patients (30,997.93 person-years) were followed from January 2003 to December 2016. A T2DM incidence rate of 17.3/1000 person-years (95%CI 15.8-18.8) was observed. Incidence of isolated hypertriglyceridemia and impaired fasting glucose (IFG) were 84.3 (95%CI 81.1-87.6) and 14.5/1000 person-years (95%CI 13.2-15.9), respectively. Mean time to T2DM onset was 10.5 years (95%CI 10.3-10.6). Variables associated with incident T2DM were age 40-50 [Hazard Ratio (HR) 1.7, 95%CI 1.4-2.1] and ≥ 50 years (HR 2.4, 95%CI 1.9-3.1); obesity (HR 2.1, 95%CI 1.6-2.8); abnormal triglyceride/HDL-cholesterol ratio (HR 1.8, 95%CI 1.51-2.2). IFG predicted T2DM (HR 2.6, 95%CI 1.7-2.5) and occurred on average 3.3 years before diabetes onset. Exposure to stavudine for ≥ 2 years was independently associated with incident T2DM [HR 1.6, 95%CI 1.0-2.2).
ConclusionBrazilian PLH under cART are at significant risk of developing T2DM and share risk factors for diabetes onset with the general population, such as older age, obesity, and having metabolic abnormalities at baseline. Moreover, stavudine use was independently associated with incident T2DM. Identifying PLH at a higher risk of T2DM can help caretakers trigger health promotion and establish specific targets for implementation of preventive measures.
Combined antiretroviral therapy (cART) has had a profound impact on HIV-associated morbidity and mortality.1 Therapeutic combinations containing drugs from different classes of antiretrovirals promoted an important and sustained suppression in viral replication, leading to immune restoration and increased survival and quality of life of people living with HIV (PLH).
Despite the benefits of the cART, long-term administration of antiretroviral drugs is often associated with severe glucose and lipid metabolic abnormalities, such as dyslipidaemia and insulin resistance.2-7 For such reason, metabolic effects have become an important clinical issue in the follow-up of PLH on cART, especially considering that adverse effects are one of the main reasons for non-adherence to or withdrawal from treatment.8
Type 2 diabetes mellitus (T2DM) is an important risk factor for cardiovascular diseases and several studies have reported that PLH may have an increased risk of T2DM.9-15 In addition to well-recognized determinants, such as ageing, male sex, obesity, smoking, infection with hepatitis C virus, and genetic characteristics, incident T2DM is apparently related to long-term administration of stavudine,2,11,14,16 zidovudine and didanosine,16 indinavir14 and other protease inhibitors.17
The aim of this study was to estimate the incidence and the mean time to T2DM onset in the Brazilian HIV/AIDS Cohort, using hierarchical modelling. Based on survival analysis, we also explored potential factors associated with the outcome, including socio-demographic and behavioural profiles, existence of comorbidities, clinical and biochemical laboratory markers, and pharmacological treatments. The identification of these biomarkers may help in starting measures to prevent T2DM in PLH.
MethodsData collection and definitionsData used in the present study were obtained from the Brazilian HIV/AIDS Cohort Study (HIV/AIDS-BCS), an ambidirectional cohort involving 13 Brazilian sites across four out of the five administrative regions of the country, comprising 26 Public Health facilities in 11 cities. The cohort includes PLH aged over 18 years, who started cART from January 2003 to December 2013 and were followed-up until December 2016. We collected information about patients’ socio-demographic profiles; HIV exposure; use of illicit drugs, alcohol and tobacco; individual or family history of diabetes, hypertension and cardiovascular diseases; laboratory assessment of immune status (CD4+ T-cell count), HIV viral load; occurrence of adverse events due to cART, and death. Data were obtained as part of the routine clinical care provided at participating health services (i.e., following a routine-care-based cohort design), extracted from patients’ clinical records by trained personnel onto standardized forms. Clinical records were reviewed at intervals not exceeding six months. Detailed information on cohort sites, eligibility and inclusion criteria, data sources and validation, outcomes, censoring criteria, availability of data and ethics statement have been previously reported.18-19
T2DM was diagnosed (case definition) when elevated fasting plasma glucose (FPG) values above 126 mg/dl (7 mmol/l) were detected on two consecutive occasions. Additionally, cases with only one FPG measure above 126 mg/dl and record of hypoglycaemic or antidiabetic drug use, such as metformin, glibenclamide, glyburide or alike were considered possible cases of T2DM. Impaired fasting glucose (IFG) was defined as fasting blood glucose levels >100 and <126 mg/dl.20
To investigate T2DM incidence and its associated factors, we excluded from the total of registries available at the HIV-BCS system any patient who presented: (1) no record of glucose and lipid laboratory tests; (2) occurrence of T2DM or IFG at baseline; and (3) absence of clinical and epidemiological information including comorbidities or classical risk factors for T2DM.
The cohort profile is described in frequency tables for qualitative variables and estimated central tendency and dispersion measures for quantitative variables. 95% confidence intervals (95%CI) were calculated using the bootstrap resampling method. 21 Incidence rates of T2DM were calculated for 1000 persons-years using the Poisson's exact test.22 Cox regression and multiple Cox regression models23 were used to investigate factors associated with incident T2DM, including different adjusted models. The database was exported to the software Statistical Package for the Social Sciences (SPSS) 24 for Windows (International Business Machines Corp, New York, USA) and R-GUI version 3.0.2 (http://www.r-project.org/) for statistical analysis.
Variables and hierarchical framework modellingFor the multiple hierarchical modelling used in the survival (time-to-event) analysis, we searched the HIV-BCS system for information concerning the dates of initiation of cART and the last clinical visit, respectively, to calculate the follow-up interval; death, loss to clinical follow-up and referral to another health service were used to characterize the censoring date. The date of occurrence of fasting hyperglycaemia was used to determine time to T2DM onset.
For modelling the following independent variables were considered: (1) patients’ socio-demographic characteristics: sex, date of birth (age); skin colour; HIV exposure category following a hierarchical characterization (sexual, blood, occupational injury, and vertical transmission); (2) illicit drugs, alcohol and tobacco use: type of substance and duration of use; (3) comorbidities: lipodystrophy, metabolic syndrome, obesity (report of abdominal obesity and obesity without definition), dyslipidaemia [hypercholesterolemia, hypertriglyceridemia or combined dyslipidaemia associated or not with low high density lipoprotein-cholesterol (HDL-C) levels], systemic arterial hypertension, hepatitis C (serological evidence); (4) cART: all antiretroviral drugs used, duration of use, date of and reason for cART discontinuation; (5): concurrent pharmacotherapy: metformin and statin use (simvastatin, atorvastatin, pravastatin, pitavastatin, or lovastatin) and duration of use; (5) laboratory tests during follow-up, including sample collection date: CD4+ T-cell counts; HIV viral loads; fasting serum glucose, triglyceride, total cholesterol, HDL-cholesterol and LDL-cholesterol concentrations. TG/HDL-C ratios were calculated and classified as abnormal if ≥ 3.5 (for men) or ≥ 2.5 (for women).24
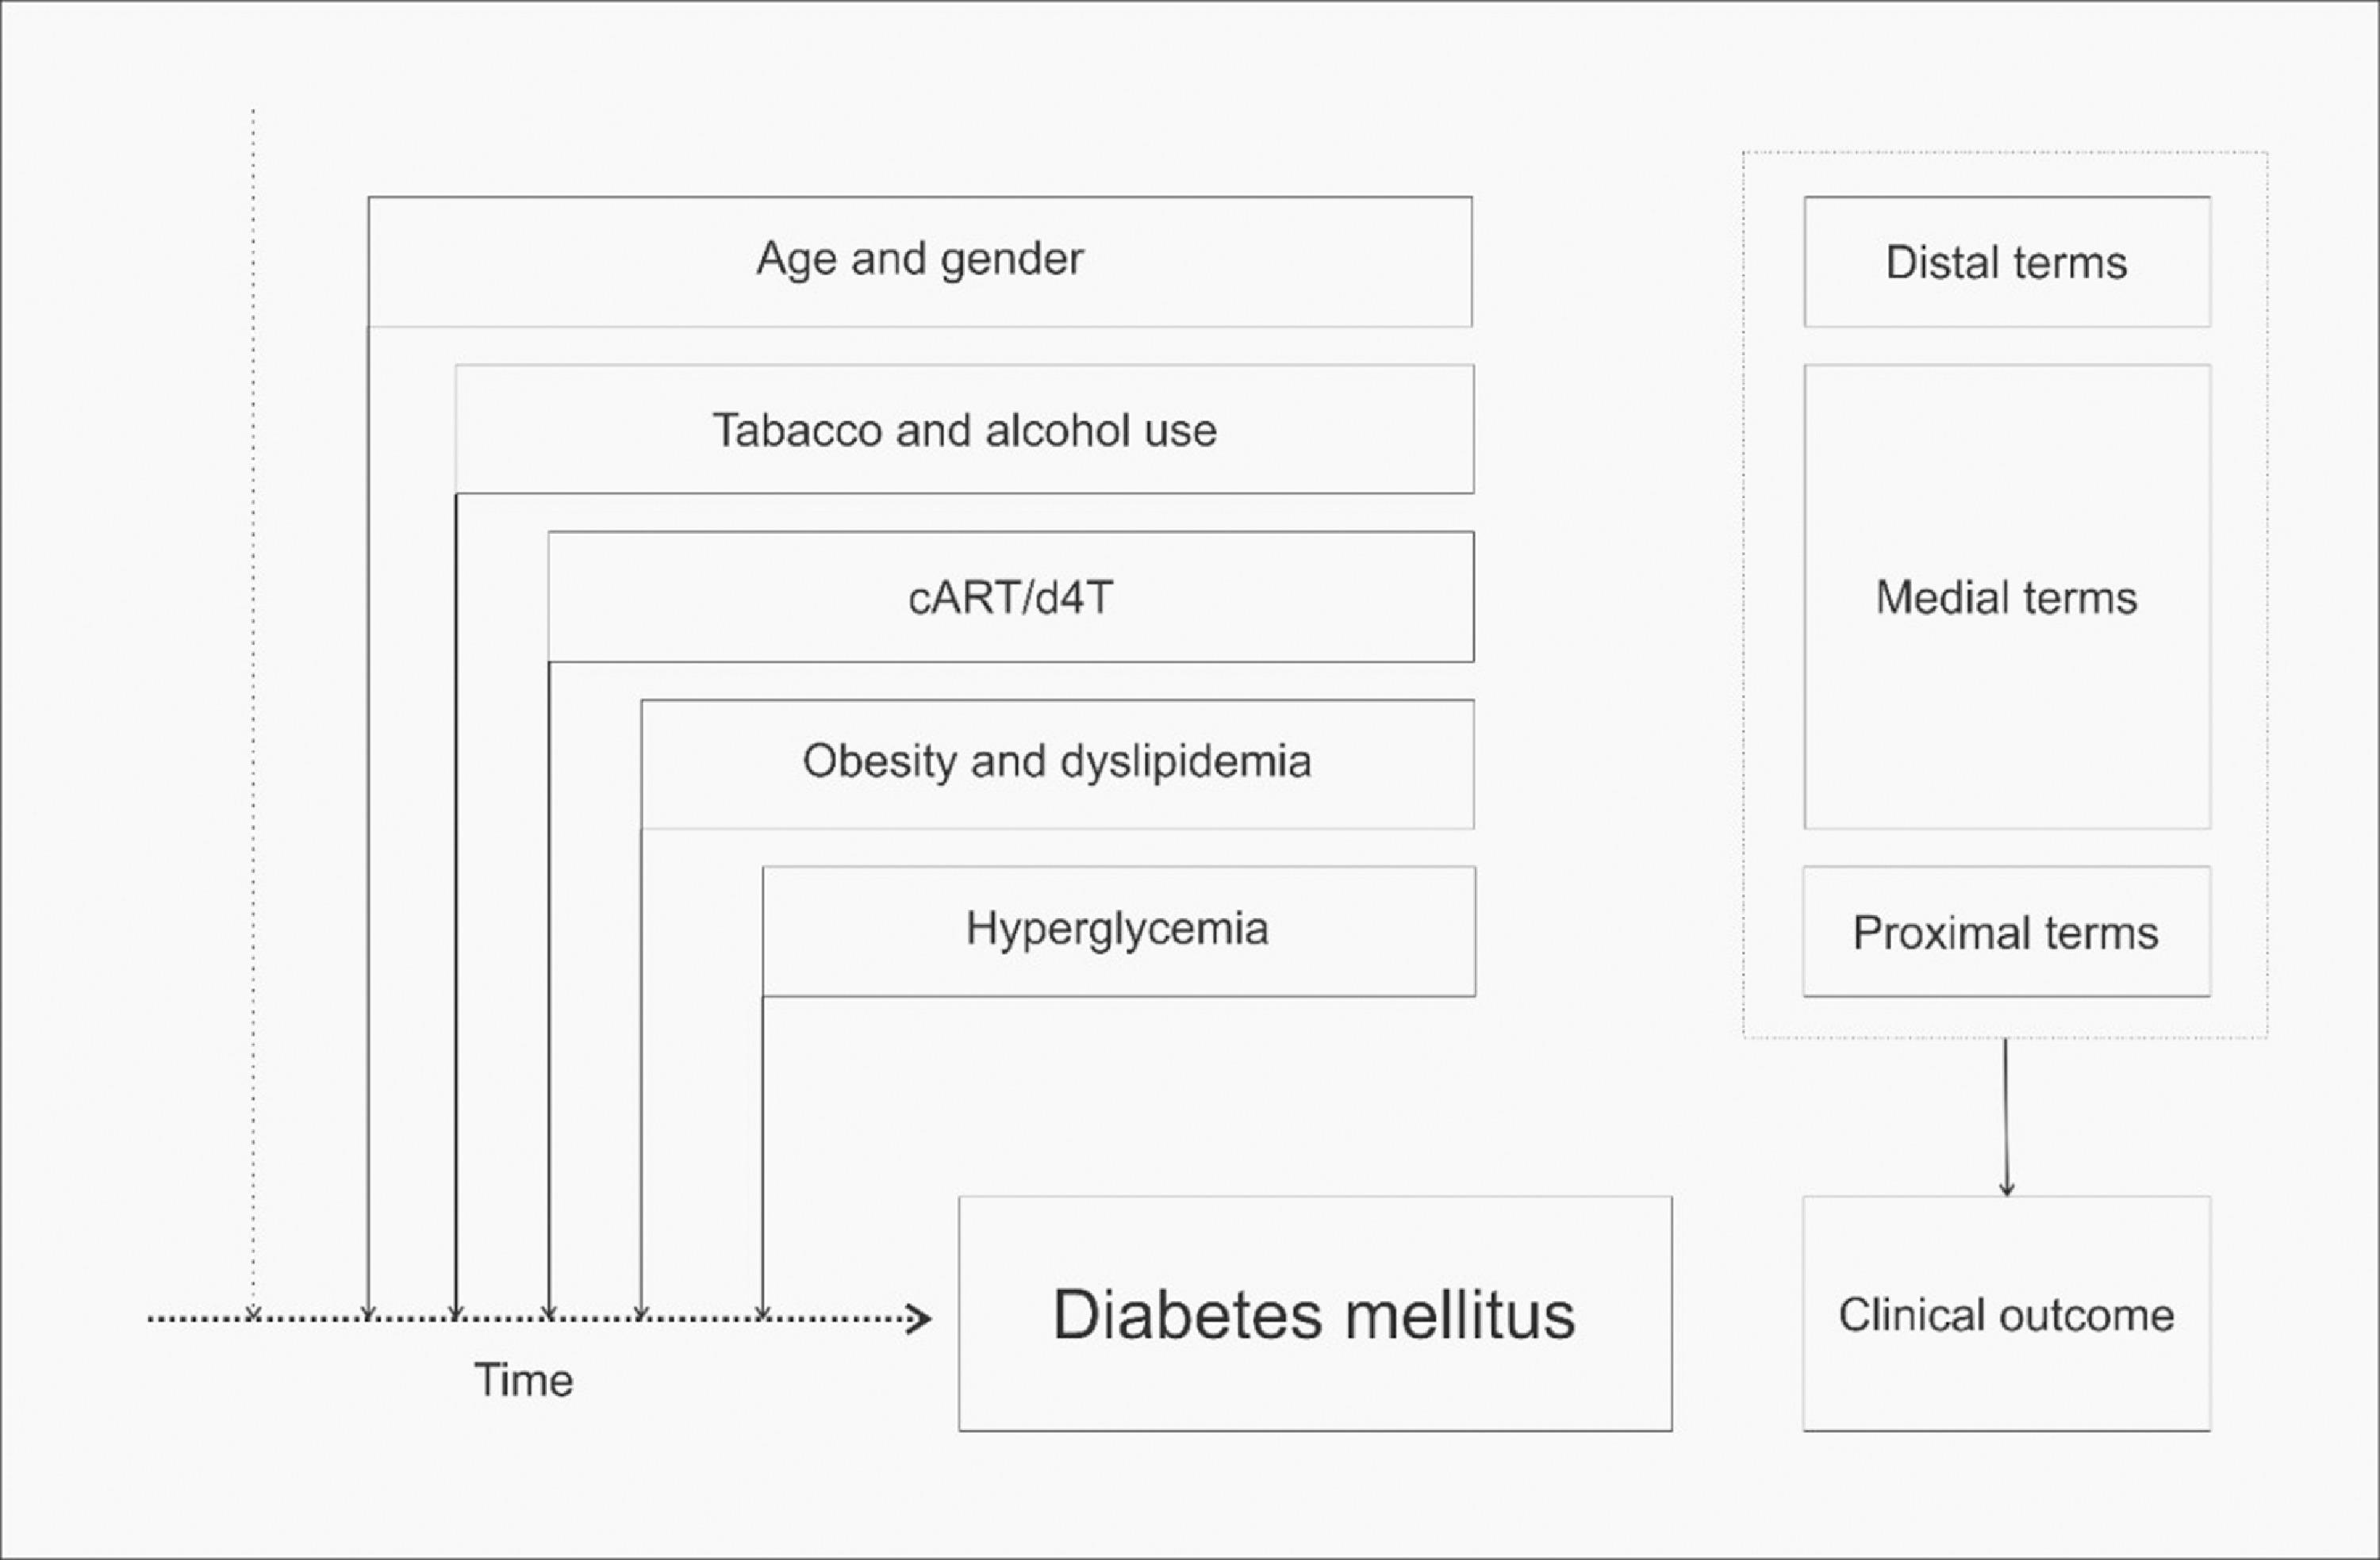
A hierarchical multiple model was used to identify predictors of T2DM based on a set of empirical propositions that indicate the strength and direction of association between predictors and the outcome. The order of entries of possible predictors into the regression equation was defined based on a pre-established conceptual framework, which takes into account biological and temporal determinants that may affect the outcome.25-26 In the hierarchical explanatory models variables were organized in three levels: (1) hyperglycaemia (IFG) as a proximal, (2) exposure to cART/stavudine (d4T) use, obesity and dyslipidaemia as intermediate, and (3) sex, age, and use of tobacco and alcohol as distal determinants (Supplementary file – Figure). Modelling started with an empty model towards a complete one. Adjustment among different models was verified using differences in the log-likelihood ratio. The Chi-square test was used to verify the hypothesis of equality among models.27
Ethical issuesThe present study was approved by the Ethics Committee at Faculdade de Medicina, Universidade de São Paulo (#229/13), in accordance with Brazilian and international regulations for research with human subjects. The dataset for this study comes from an ambidirectional cohort. In the first retrospective phase, the IRB waived the requirement for written informed consent, given subject anonymity and data confidentiality were ensured throughout the research. In the second prospective phase, all participants provided written informed consent for participation in the study.
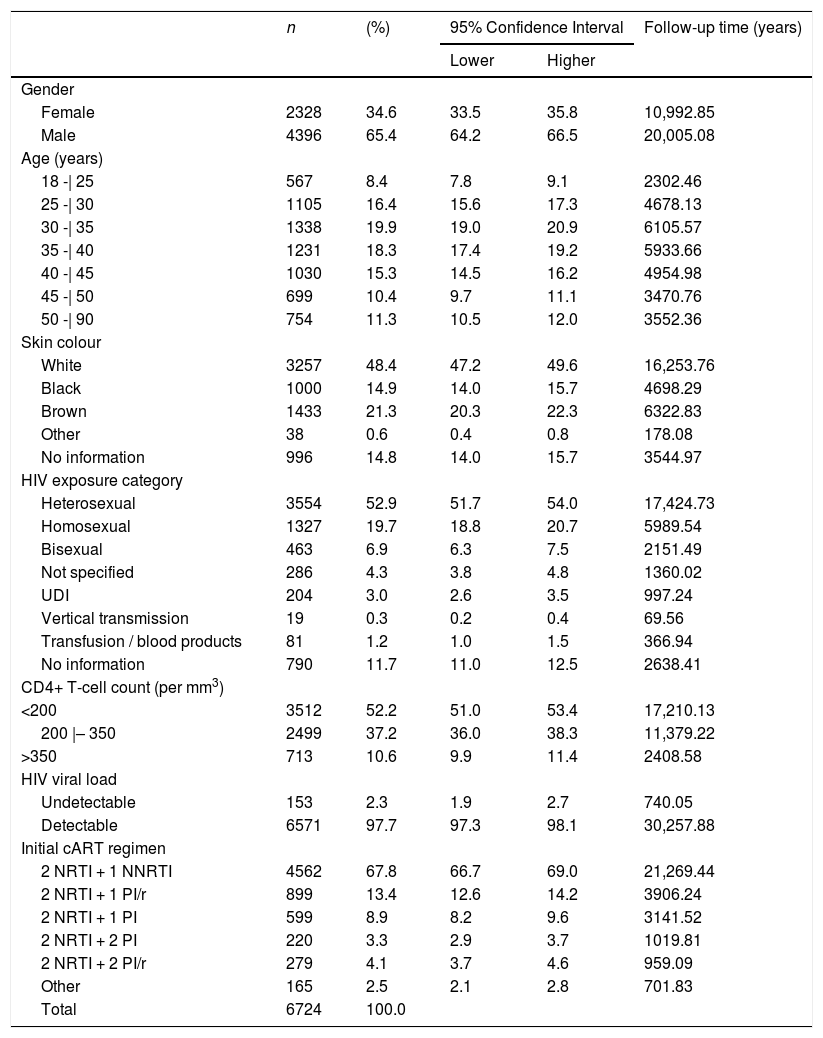
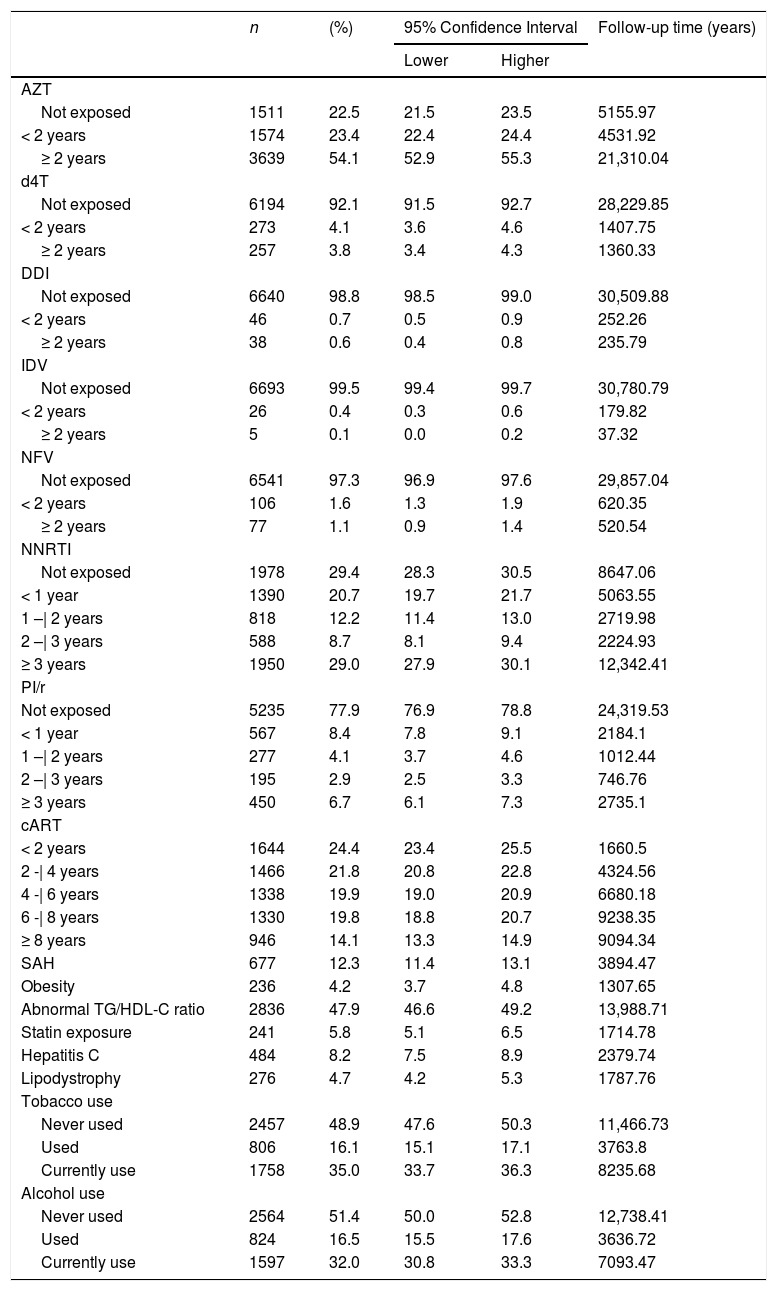
ResultsFrom a total of 8,674 subjects enrolled in the HIV-BCS system, 1950 (22.5%) were excluded: 870 (44.6%) had no records of blood glucose and lipid assessment; 262 (13.4%) patients already presented T2DM or IFG at baseline; 136 (6.7%) had no records of CD4+ T-cell count or HIV viral load assessments; 431 (22.1%) registries had no data on CD4+ T-cell counts or HIV viral load after initiation of cART; 151 (7.1%) had no relevant clinical and epidemiological information in their medical records; and 100 (5.1%) had no linkage code with the National HIV/AIDS surveillance registry. The final study cohort thus comprised 6724 individuals (Table 1). It is important to highlight that excluded patients did not differ significantly from study participants concerning sex, age, skin colour, HIV exposure category, initial cART regimen and CD4+ T-cell count and HIV viral load at initiation of cART (Supplementary File - Table).
Characteristics of patients. Brazilian HIV/AIDS Cohort, 2003-16.
NRTI: nucleoside analogue reverse transcriptase inhibitor; NNRTI: non-nucleoside analogue reverse transcriptase inhibitor;
PI: protease inhibitor; PI/r: Protease inhibitor boosted with ritonavir;
UDI: injecting drug user. Data include proportion, confidence interval and cumulative follow-up time for each characteristic.
Participants’ socio-demographic characteristics, as well as their mode of HIV exposure, initial cART regimen and laboratory baseline parameters are detailed in Table 1.
Table 2 describes duration of cART, including time of use of each antiretroviral drug. Zidovudine (AZT) was the most commonly used antiretroviral drug. A total of 3639 individuals (54.1%) used AZT for more than two years, accumulating 21,310.04 years of exposure to this compound. Information about comorbidities and use of alcohol and tobacco and statins is also presented in Table 2.
Antiretroviral therapy (cART) exposure time and existing comorbidities. Brazilian HIV/AIDS Cohort, 2003-16.
AZT: zidovudine; d4T: stavudine; DDi: didanosine; IDV: indinavir; NFV: nelfinavir; cART: antiretroviral therapy; NNRTI: non-nucleoside analogue reverse transcriptase inhibitors; PI/r: protease inhibitor boosted with ritonavir; SAH: systemic arterial hypertension. Data include proportion, confidence interval and cumulative follow up time.
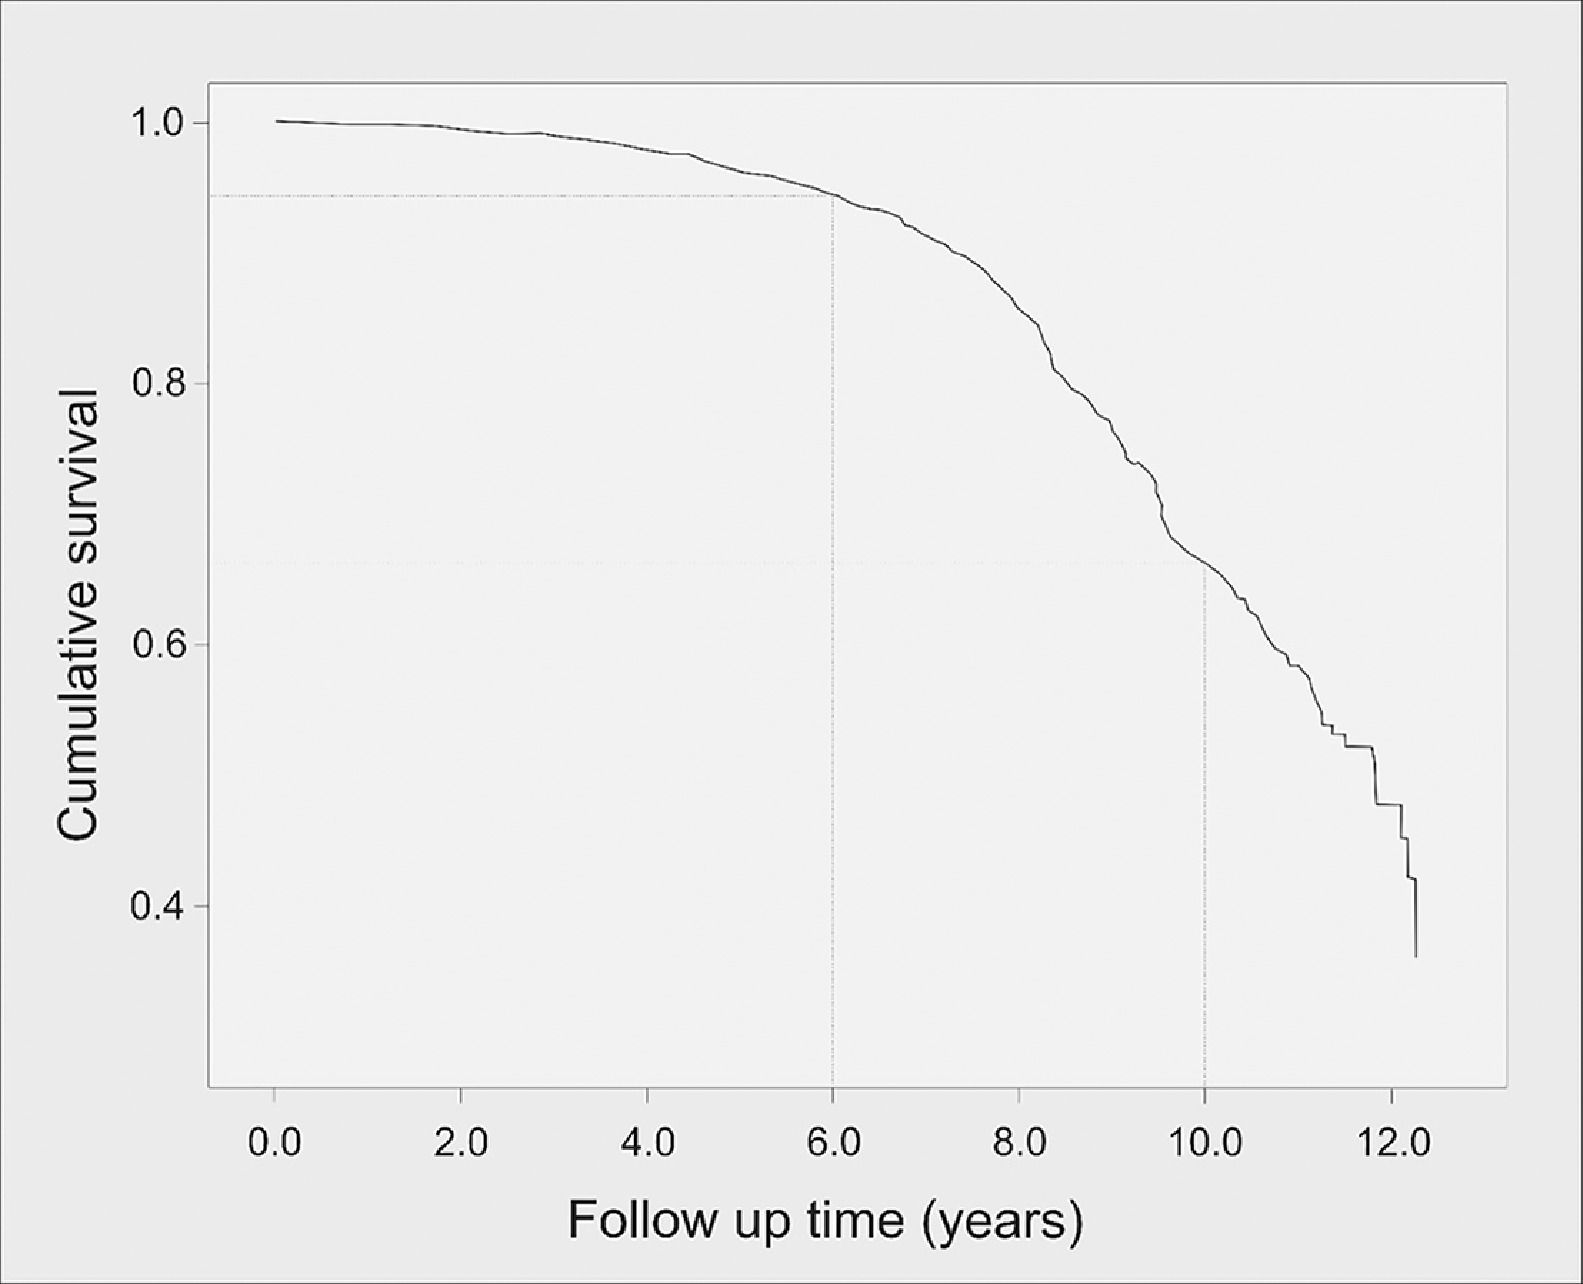
Overall T2DM incidence in the cohort was 17.3 per 1000 person-years (95%CI 15.8-18.8; N=537), whereas incidence of isolated hypertriglyceridemia was 84.3 per 1000 person-years (95%CI 81.1-87.6; N=2.616); and incidence of IFG was 14.5 per 1000 person-years (95%CI 13.2-15.9; N=452). Mean time to DM onset was 10.5 years (95%CI 10.3-10.6), with a median of 11.8 years (95%CI 11.3-12.3). The probability of DM onset occurring up to the sixth year of follow-up was 5.5% but increased dramatically after this period. Fig. 1 presents the survival curve until T2DM onset. Mean time to occurrence of IFG was significantly lower, being estimated at 7.2 years (95%CI 7.0-7.5).
 onset (in years). Brazilian HIV/AIDS Cohort, 2003-16.")
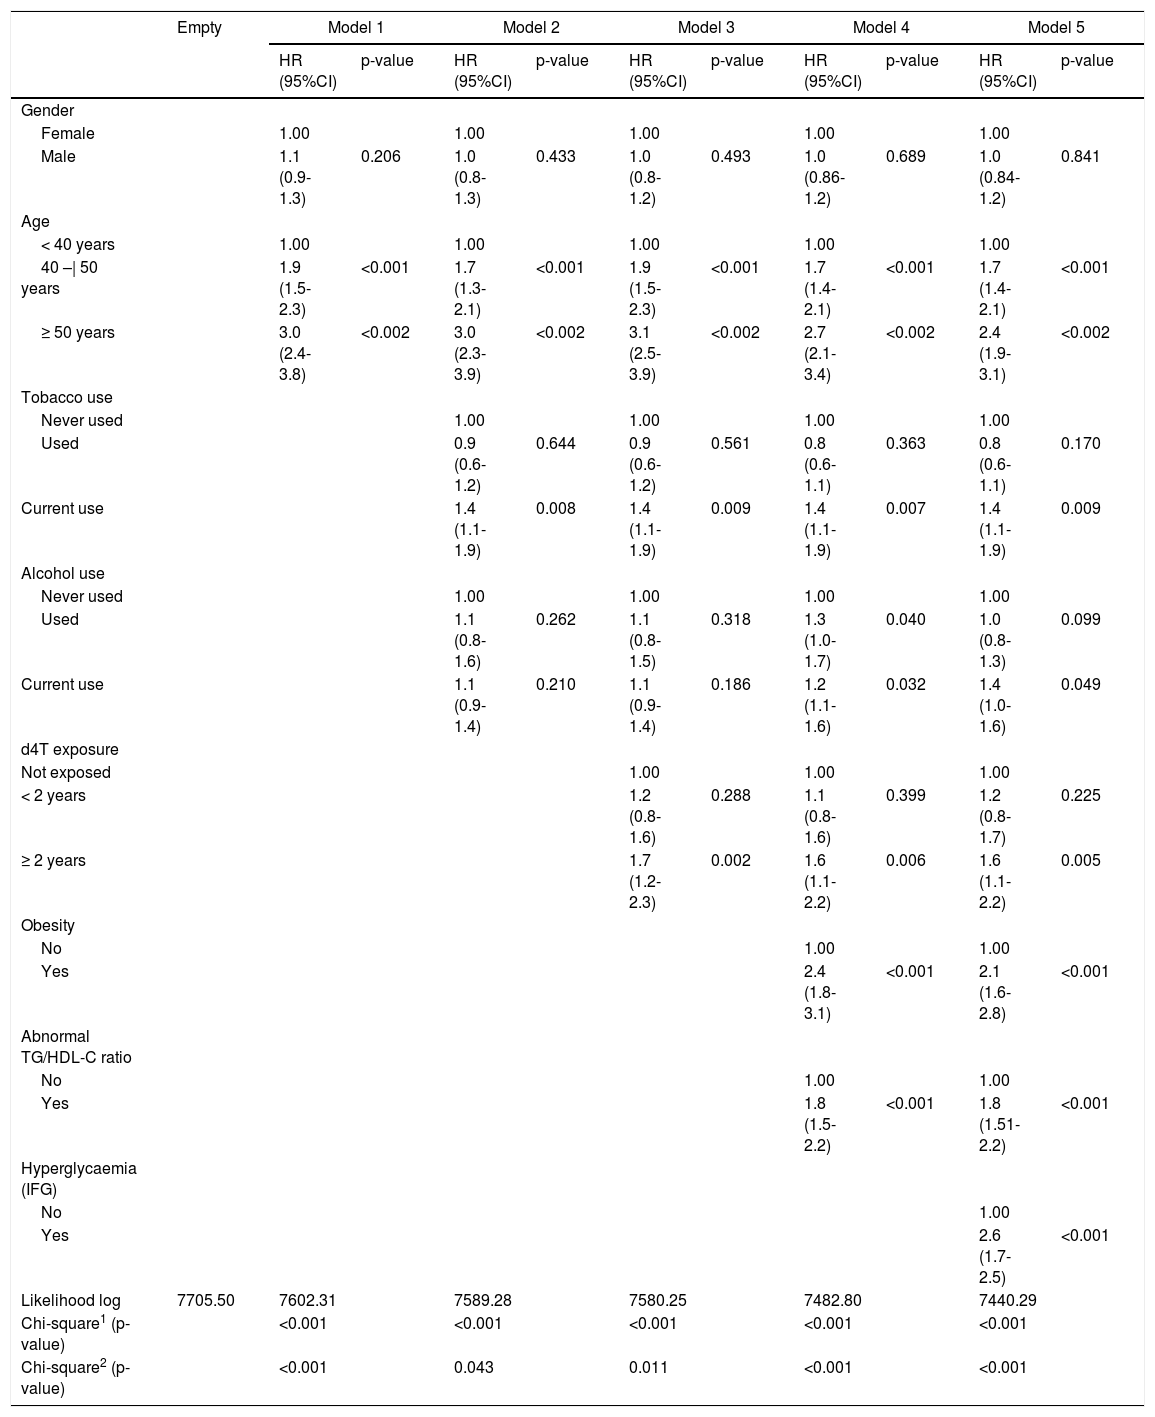
In the hierarchical modelling, variables most strongly associated with incident T2DM included age between 40 and 50 years [HR 1.7 (95%CI 1.4-2.1), p < 0.001] and ≥ 50 years [HR 2.4 (95%CI 1.9-3.1), p < 0.002]; obesity [HR 2.1 (95%CI 1.6-2.8), p < 0.001]; abnormal TG/HDL-C ratios [HR 1.8 (95%CI 1.51-2.2), p < 0.001]; and having a previous detection of hyperglycemia [HR 2.6 (95%CI 1.7-2.5), p < 0.001]. Other variables were also associated with the outcome, though with lower magnitudes (Table 3).
Hierarchical model predicting incident type 2 diabetes mellitus (T2DM). Brazilian HIV/AIDS Cohort, 2003-16.
| Empty | Model 1 | Model 2 | Model 3 | Model 4 | Model 5 | ||||||
|---|---|---|---|---|---|---|---|---|---|---|---|
| HR (95%CI) | p-value | HR (95%CI) | p-value | HR (95%CI) | p-value | HR (95%CI) | p-value | HR (95%CI) | p-value | ||
| Gender | |||||||||||
| Female | 1.00 | 1.00 | 1.00 | 1.00 | 1.00 | ||||||
| Male | 1.1 (0.9-1.3) | 0.206 | 1.0 (0.8-1.3) | 0.433 | 1.0 (0.8-1.2) | 0.493 | 1.0 (0.86-1.2) | 0.689 | 1.0 (0.84-1.2) | 0.841 | |
| Age | |||||||||||
| < 40 years | 1.00 | 1.00 | 1.00 | 1.00 | 1.00 | ||||||
| 40 –| 50 years | 1.9 (1.5-2.3) | <0.001 | 1.7 (1.3-2.1) | <0.001 | 1.9 (1.5-2.3) | <0.001 | 1.7 (1.4-2.1) | <0.001 | 1.7 (1.4-2.1) | <0.001 | |
| ≥ 50 years | 3.0 (2.4-3.8) | <0.002 | 3.0 (2.3-3.9) | <0.002 | 3.1 (2.5-3.9) | <0.002 | 2.7 (2.1-3.4) | <0.002 | 2.4 (1.9-3.1) | <0.002 | |
| Tobacco use | |||||||||||
| Never used | 1.00 | 1.00 | 1.00 | 1.00 | |||||||
| Used | 0.9 (0.6-1.2) | 0.644 | 0.9 (0.6-1.2) | 0.561 | 0.8 (0.6-1.1) | 0.363 | 0.8 (0.6-1.1) | 0.170 | |||
| Current use | 1.4 (1.1-1.9) | 0.008 | 1.4 (1.1-1.9) | 0.009 | 1.4 (1.1-1.9) | 0.007 | 1.4 (1.1-1.9) | 0.009 | |||
| Alcohol use | |||||||||||
| Never used | 1.00 | 1.00 | 1.00 | 1.00 | |||||||
| Used | 1.1 (0.8-1.6) | 0.262 | 1.1 (0.8-1.5) | 0.318 | 1.3 (1.0-1.7) | 0.040 | 1.0 (0.8-1.3) | 0.099 | |||
| Current use | 1.1 (0.9-1.4) | 0.210 | 1.1 (0.9-1.4) | 0.186 | 1.2 (1.1-1.6) | 0.032 | 1.4 (1.0-1.6) | 0.049 | |||
| d4T exposure | |||||||||||
| Not exposed | 1.00 | 1.00 | 1.00 | ||||||||
| < 2 years | 1.2 (0.8-1.6) | 0.288 | 1.1 (0.8-1.6) | 0.399 | 1.2 (0.8-1.7) | 0.225 | |||||
| ≥ 2 years | 1.7 (1.2-2.3) | 0.002 | 1.6 (1.1-2.2) | 0.006 | 1.6 (1.1-2.2) | 0.005 | |||||
| Obesity | |||||||||||
| No | 1.00 | 1.00 | |||||||||
| Yes | 2.4 (1.8-3.1) | <0.001 | 2.1 (1.6-2.8) | <0.001 | |||||||
| Abnormal TG/HDL-C ratio | |||||||||||
| No | 1.00 | 1.00 | |||||||||
| Yes | 1.8 (1.5-2.2) | <0.001 | 1.8 (1.51-2.2) | <0.001 | |||||||
| Hyperglycaemia (IFG) | |||||||||||
| No | 1.00 | ||||||||||
| Yes | 2.6 (1.7-2.5) | <0.001 | |||||||||
| Likelihood log | 7705.50 | 7602.31 | 7589.28 | 7580.25 | 7482.80 | 7440.29 | |||||
| Chi-square1 (p-value) | <0.001 | <0.001 | <0.001 | <0.001 | <0.001 | ||||||
| Chi-square2 (p-value) | <0.001 | 0.043 | 0.011 | <0.001 | <0.001 | ||||||
Note: d4T, stavudine
Data shown as estimates of hazard ratio (HR), 95% confidence interval (95%CI) and descriptive level (p-value).
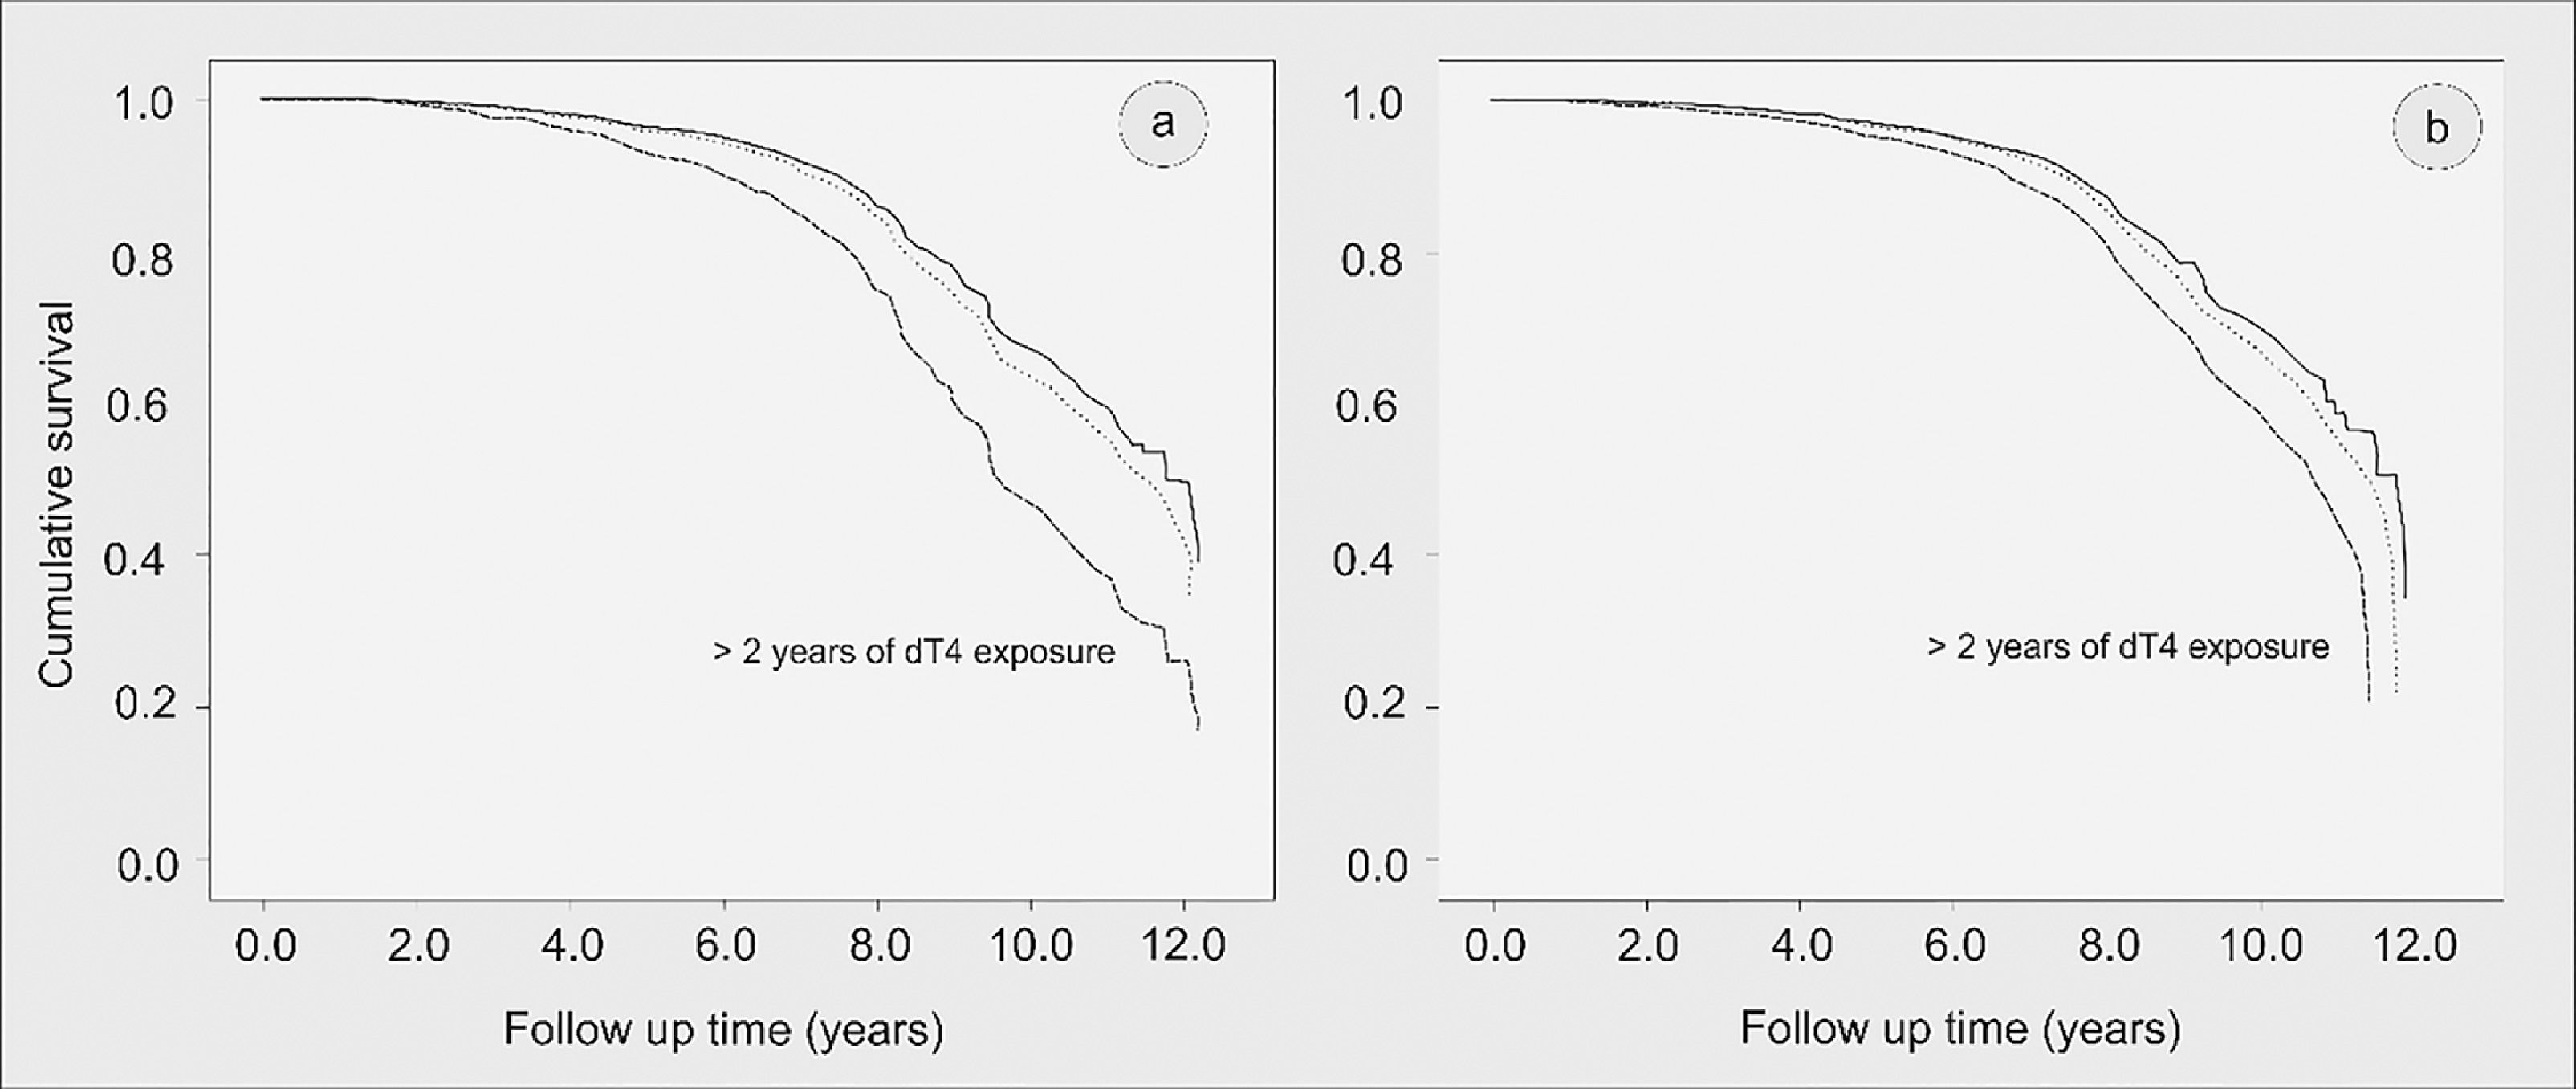
After adjusted modelling, exposure to stavudine (d4T) for two or more years (variable inserted in Model 3) remained significantly associated with incident T2DM [HR 1.6 (95%CI 1.0-2.2), p = 0.005]. The impact of d4T use in the Kaplan-Meier survival curves until diabetes onset is shown in Fig. 2 (2a for the unadjusted curve, and 2b for the adjusted curve).
 onset (in years) according to duration of stavudine (d4T) use (a) unadjusted and (b) after adjustment for sex, age, tobacco and alcohol use, obesity, abnormal triglyceride: HDL-cholesterol, and hyperglycemia before T2DM onset. Brazilian HIV/AIDS Cohort, 2003-16.")
Kaplan-Meier curve of survival until type 2 diabetes mellitus (T2DM) onset (in years) according to duration of stavudine (d4T) use (a) unadjusted and (b) after adjustment for sex, age, tobacco and alcohol use, obesity, abnormal triglyceride: HDL-cholesterol, and hyperglycemia before T2DM onset. Brazilian HIV/AIDS Cohort, 2003-16.
In this study, we observed that T2DM was a common metabolic disorder in the Brazilian HIV/AIDS cohort, with an overall incidence of 17.3 per 1000 person-years and its onset occurred on average a decade after initiation of cART. In addition, simple biomarkers, such as high TG/HDL-C ratios and elevated fasting blood glucose to diagnose IFG, were robustly associated with T2DM onset with the former occurring approximately three years before the latter. Finally, stavudine, a nucleoside analogue of thymidine that inhibits HIV reverse transcriptase, often used in the first decades of antiretroviral therapy, was the only antiretroviral drug independently associated with T2DM in the cohort, increasing the relative risk of the outcome by 60%.
Incident T2DM has been consistently described among PLH on cART and constitutes a matter of clinical concern in the management of these patients for its impact in morbidity3-5,10-17,28-31 and mortality rates.32-34 Our findings are in line with those reported by Capeau et al.14, who followed 1046 patients for 7846 person-years. In this French cohort the incidence rate of T2DM was 14.1 per 1000 person-years and the outcome was associated with exposure to several antiretroviral regimens that included indinavir (0-1 year: HR = 2.53), stavudine (0-1 year: HR = 2.56, 1-2 years: HR = 2.65) and didanosine (2-3 years: HR = 3.16). Likewise, in a North American cohort comprising 13,632 individuals, and total follow-up of 88,359 person-years, the incidence of T2DM was 13.6 per 1000 person-years in patients on cART, in contrast to 11.35 per 1000 person-years among patients not exposed to cART.28 In that study authors also suggested that the risk of T2DM onset increased with exposure to protease inhibitors [relative risk = 1.35 (95% CI 1.03-1.78)], after adjusting for other known risk factors.
In our cohort, factors associated with incident T2DM corroborate previously well-recognized biomarkers for this outcome in non-HIV populations, such as age over 40 years, current tobacco use, obesity and abnormal TG/HDL-C ratios, which are all associated with insulin resistance.35-37 Particularly noteworthy is the sub-study of the Brazilian Longitudinal Study of Adult Health (ELSA-Brasil), conducted with 1546 civil servants of our institution (University of São Paulo), aged 23 to 63 years, with a mean follow-up of 11 years. In this cohort Sitnik et al.38 reported an overall incidence rate of T2DM of 9.8 per1000 person-years, and age, obesity, incident or prevalent hypertension or dyslipidaemia were the main predictors of diabetes onset.
Among PLH, these same characteristics had also been identified in previous studies.14-16,28 In a systematic review and meta-analysis of 44 cohort studies involving PLH, with a total follow-up of 396,496 person-years, the pooled incidence rate of T2DM was estimated as 13.7 (95% CI, 13-20) per 1000 person-years.39 Predictors of diabetes onset in that study included ageing, family history of diabetes, Black/Hispanic origin, overweight/obesity, lipodystrophy, dyslipidaemia, metabolic syndrome and increased baseline fasting glucose levels. Furthermore, using a retrospective study design, Squilace et al.40 showed among PLH that an elevated TG/HDL-C ratio (>third quartile or 4.5) was an independent predictor of T2DM onset. The TG/HDL-C ratio could be used not only as indicator of a pro-atherogenic lipid profile, but also as a simple biomarker of insulin resistance. This occurs due to the close association between free fatty acid influx to the liver and muscle with increased very low-density lipoprotein (VLDL) synthesis and reduced glucose disposal.41-43
Of importance, in this study IFG was strongly associated with incident T2DM, being detected on average 3.3 years before diabetes onset. These results suggest that dysglycemia in PLH on cART may be used as a prognostic biomarker to identify individuals at risk for T2DM, predicting its onset. In fact, such an association has also been recently described for Brazilian non-HIV populations, suggesting clinicians could use intermediate hyperglycemia as a valuable biomarker to predict progression to T2DM.44
In a mechanistic perspective, long-term exposure to antiretroviral drugs may lead to T2DM by initially inducing insulin resistance, a common condition in the follow-up of PLH. These drugs may directly induce insulin resistance by interfering with insulin signalling at the cellular level, or indirectly, as a consequence of the effects of cART on lipid metabolism. However, since PLH are treated with combined antiretroviral regimens that include drugs which may differ in their capacity to cause insulin resistance, it ends up being hard to claim that one particular drug accounts for the development of T2DM.45
Among the different components of antiretroviral regimens used by patients in our cohort, stavudine deserves a special remark. Though regarded as effective in inhibiting HIV replication when used in combined pharmacotherapy, it was frequently associated with severe adverse effects, related to both acute and chronic toxicities, resulting in peripheral neuropathy, lactic acidosis, hyperlactatemia, lipoatrophy, dyslipidemia and T2DM.46 As a result of these unfavourable outcomes, in 2010 the World Health Organization recommended replacing stavudine with tenofovir or zidovudine in initial HIV treatment regimens.47 Accordingly, Brazil abandoned stavudine use in adults starting cART in 2012, and national guidelines adopted combined lamivudine and tenofovir in association with dolutegravir, an HIV integrase strand transfer inhibitor (INSTI), as the preferred regimen for cART initiation instead.48
More recently INSTI-based combined ART regimens have been associated with significant weight gain and therefore raising a concern about a potential increased risk of T2DM onset.49-50 Despite the fact that these compounds have less metabolic adverse effects as compared to nucleoside reverse transcriptase (NNRTI) and protease inhibitors (PI), the incidence T2DM among 22,884 patients receiving INSTI-based combinations in Canada and the United States from 2007 to 2017 was reported as 10.7 per 1000 person-years with no significant difference compared to patients on other antiuretrovirals.51
We should point out that our study presents intrinsic limitations related to its routine-care-based cohort design. The analysis was exclusively based on secondary data obtained in clinical follow-up visits to participating centers and retrieved from medical records by the study investigators. This may account for incomplete information, missed data due to lack of record standardization and errors in data collection. Furthermore, the lack of information about family history of comorbidities, dietary characteristics, physical activity patterns, and the unavailability of data on inflammatory biomarkers prevented a more robust adjustment of the T2DM prediction model. Finally, we could not assess the impact of INSTI-based antiretroviral combinations in the development of T2DM since these drugs were not available in Brazil at the study timeframe.
Nevertheless, the prolonged follow-up of the cohort (30,997.93 person-years) should be emphasized as strength of this study, yielding considerable sensitivity in its ability to assess the occurrence of chronic events such as T2DM properly. In addition, the fact that the Brazilian HIV/AIDS Cohort included patients coming from different regions nationwide confers a strong representativeness of the profile of PLH in the country.
The findings of this study have relevant implications for the clinical management of PLH. Given that abnormalities in glucose and lipid metabolism are common in this population and pose them under increased risk for cardiovascular events, close monitoring of such biomarkers should be systematically undertaken in patients on cART. Moreover, health professionals should strongly consider incorporating complementary primary prevention measures, widely incorporated in health promotion for all, including intensive lifestyle changing programmes with nutritional counselling, promotion of physical activity and smoking cessation in the comprehensive care of PLH to reduce the risk of T2DM onset.
Authors’ contributionsAJFC, AG, MME, RDS and ACS made substantial contributions to the study conceptiualization, methodology and data curation. Formal data analysis was performed by AJFC. Validation of results was performed by AJFC, AG, MME, JAM, RDS and ACS. All authors participated in writing the original draf of the manuscript; RDS and ACS were in charge of manuscript revew and editing, adding important intellectual content. All -authors read and approved the final manuscript.
Funding sourcesThis work was supported by the Brazilian National Council for Scientific and Technological Development-CNPq (grants #37/2008 and 69/2010), the Brazilian National Ministry of Health, the Pan American Health Organization, the STD/AIDS Referral and Training Centre/ São Paulo State Health Department and the Evandro Chagas Clinical Research Institute, affiliated to the Oswaldo Cruz Foundation. Alex Jones Flores Cassenote was given a Ph.D. Student scholarship from the São Paulo Research Foundation – FAPESP (#2013/18158-0). RDS and ACS are recipients of research grants from the Brazilian National Council for Scientific and Technological Development - CNPq (grants #303734/2018-3 and #304928/2018-6). Funders had no role in study design, data collection, analysis, decision to publish, or preparation of the manuscript.
The authors thank graduate students Jackeline Oliveira Gomes and Renata Miotto for their dedicated work verifying records from the HIV-BCS database, organizing the study database, and contribution to manuscript review.
Suppplementary Table. Characteristics of included and excluded patients. Brazilian HIV/AIDS Cohort, 2003-16.
