


Although patients’ clinical conditions have been shown to be associated with coronavirus disease (COVID-19) severity and outcome, their impact on hospital costs are not known. This economic evaluation of COVID-19 admissions aimed to assess direct and fixed hospital costs and describe their particularities in different clinical and demographic conditions and outcomes in the largest public hospital in Latin America, located in São Paulo, Brazil, where a whole institute was exclusively dedicated to COVID-19 patients in response to the pandemic.
MethodsThis is a partial economic evaluation performed from the hospital´s perspective and is a prospective, observational cohort study to assess hospitalization costs of suspected and confirmed COVID-19 patients admitted between March 30 and June 30, 2020, to Hospital das Clínicas of the University of São Paulo Medical School (HCFMUSP) and followed until discharge, death, or external transfer. Micro- and macro-costing methodologies were used to describe and analyze the total cost associated with each patient's underlying medical conditions, itinerary and outcomes as well as the cost components of different hospital sectors.
ResultsThe average cost of the 3254 admissions (51.7% of which involved intensive care unit stays) was US$12,637.42. The overhead cost was its main component. Sex, age and underlying hypertension (US$14,746.77), diabetes (US$15,002.12), obesity (US$18,941.55), chronic renal failure (US$15,377.84), and rheumatic (US$17,764.61), hematologic (US$15,908.25) and neurologic (US$15,257.95) diseases were associated with higher costs. Age strata >69 years, reverse transcription polymerase chain reaction (RT-PCR)-confirmed COVID-19, comorbidities, use of mechanical ventilation or dialysis, surgery and outcomes remained associated with higher costs.
ConclusionKnowledge of COVID-19 hospital costs can aid in the development of a comprehensive approach for decision-making and planning for future risk management.
The economic impact of the COVID-19 pandemic on health systems worldwide is a major concern, and there is an emergent need for additional resources and financial investments. The available hospital capacity, including hospital facilities, equipment, supplies and health professionals, have been significantly increased. Economic evaluations are thus essential to ascertain the health care-related resources and costs required for treating patients with this new disease.1
Available data suggest that 5–20% of patients with COVID-19 require hospitalization and between 14 and 20% of them require intensive care unit (ICU) admission.2-4 Underlying medical conditions and patient characteristics have already been shown to be associated with disease severity and outcomes. Comorbidities also affect resource and treatment requirements as they can result in longer length of hospital stay, mechanical ventilation or dialysis, among others.2,5,6
The setting of this study was the Hospital das Clínicas of the University of São Paulo Medical School (HCFMUSP), the largest public hospital complex in Latin America, with 2400 beds, located in the state of Sao Paulo, Brazil. The healthcare system in Brazil is composed of both private (paid by health insurance or out-of-pocket) and public (paid directly by the government) providers. The Unified Health System (UHS) represents the public provider, with universal access, and it is the single healthcare provider of more than 70% of the population.7 HCFMUSP is part of the UHS and plays an important role in quaternary care and high complexity emergencies in the state of São Paulo´s healthcare network, which was already operating at full capacity before 2020.8
HCFMUSP was located in the national epicenter of the pandemic in the first months of 2020,9 and the 900 beds of its Central Institute, including 300 ICU beds, 206 of which were newly installed in response to the pandemic, were entirely dedicated to COVID-19 patients referred for admission from the state's public healthcare network; HCFMUSP has delivered tertiary hospital care to more than 4000 severe COVID-19 patients.10-12 Due to the large number of hospitalized patients, the fast response to the disaster, the academic characteristics of the institution and its importance to the healthcare system, the results of the studies conducted at HCFMUSP are of great interest to national health policy makers. The centralization of care in a single institute provided a unique opportunity for a precise and homogeneous economic evaluation of these admissions. The aim of this study was to describe the direct and fixed hospital costs related to the treatment of hospitalized patients with COVID-19 as well as the main cost components and related clinical factors to support health policy makers in optimizing the use of financial resources.
Material and methodsStudy design, setting, inclusion and exclusion criteria and ethical aspectsThis is a partial economic evaluation (cost of illness) and a prospective, observational cohort study. It was conducted at HCFMUSP, a quaternary hospital located in the city of Sao Paulo, Brazil. The target population was all consecutive patients admitted from March 30 to June 30, 2020, with suspected, probable or confirmed COVID-19.13,14 The time horizon of the analyses was from admission until clinical outcome, so patients were followed until discharge, death, or external transfer. The study end date was defined as August 25, 2020. The research protocol was approved by the institutional ethics committee (CAPPESQ: #4.107.580).
Clinical data and outcome definitionsData were obtained as part of the routine clinical care provided (routine-care-based cohort), extracted from patients’ electronic health records (EHRs), and organized into standardized forms by trained extractors. Variables included sex, age, COVID-19 confirmation by reverse transcription polymerase chain reaction (RT-PCR) or serologic tests,15,16 underlying medical conditions reported by patients or relatives, procedures associated with severe disease (mechanical ventilation, tracheostomy, dialysis or surgery), clinical outcome (discharge, death, external transfer or still hospitalized on August 25th) and patient itinerary (length of stay (LOS) in the emergency department (ED), hospital wards and ICUs for severe cases).17
Cost analysisThe analysis was performed from the hospital's perspective using primary data, with a mixed methodology: micro and macrocosting.18 Resources used by each patient were identified and quantified based on the patient's electronic prescriptions and valued according to the hospital's supply unit information, enabling ascertainment and description of individuals’ admission costs. Direct and fixed costs were included. Direct-cost subcategories of microcosting for individuals’ admission costs included drugs, laboratory tests, radiologic exams, blood components and nutrition requirements. Direct costs of hospital supplies at the ED, wards and ICUs, including general supplies and personal protective equipment (PPE), were apportioned by patient day in each hospital sector using macrocosting top-down methodology.
Other direct costs (human resources - medical staff and nonmedical staff) and the fixed costs (hospital services - laundry, food, administration, maintenance contracts, financing and general services) for each sector were apportioned by bed-day, resulting in daily medical staff, nonmedical staff and general daily cost estimates for each sector.
Indirect costs that were not related to the patient's hospital admission (e.g., outpatient hospital visits, patient transportation, etc.) or the hospital´s functioning (e.g., productivity losses) were not included in this analysis.
The total admission cost for each patient was estimated by (i) the daily costs calculated according to the patient's itinerary in the ED, wards and ICUs (PPE, supplies, medical staff, nonmedical staff, sector´s general daily cost) added to (ii) the direct costs measured by direct consumption (medication, laboratory tests, radiologic exams, nutrition and blood components). The total sector cost (ED, wards and ICUs) was calculated by summing all admission costs of each sector.
The costs were recorded in Brazilian Real (R$) and converted into US dollars (US$). From March 30th to June 30th, US$1 was worth an average of R$5.55.
Data analysisContinuous variables are expressed as mean ± standard deviation, and categorical variables are expressed as the number of cases and proportions. To assess the impact of different variables on hospital cost, the LOS of each patient subgroup was considered. An average cost (total cost/number of admissions) and a cost/day (total cost/total follow-up in days) were estimated for each subgroup. A rate (by 100 persons/days) was obtained by dividing each subgroup number of admissions by its total follow-up. We determined the cost/rate by dividing each subgroup total cost by this rate.
Missing data were treated as "no information" in the analyses, and they occurred only regarding comorbidities of 371 patients (11.4%) and SARS-CoV-2 RT-PCR results of 164 (5.0%) patients; there were no missing data for the outcome variable. To fit multiple models, cases with missing data for some variables were excluded.
The applied hypothesis tests considered an alpha error of 0.05. Continuous variables were compared among groups using Mann-Whitney U tests for independent samples. To obtain the adjusted impact of the variables of interest on the total cost, a gamma generalized linear model (GLM) for y with a log link function was proposed. Statistical analyses were carried out using IBM SPSS Statistics v. 26.0 (SPSS Inc., Chicago, Illinois, USA) and R packages (R Core Team, Vienna, Austria).
ResultsStudy populationBetween March 30 and June 30, 2020, 3254 patients with suspected or confirmed COVID-19 were admitted, 54.5% of whom were male, with an overall mean ± standard deviation age of 58 (±18 years). COVID-19 was confirmed by RT-PCR or serologic tests in 2512 (77.2%) patients, and the remainder were treated for presumed infections based on clinical and/or radiologic findings. Only 376 (11.6%) of the admissions were patients with no comorbidities, and the others had 1 (23.2%), 2 or 3 (40%) or more than 3 (13.9%) comorbidities. The most frequent comorbidities were hypertension (48.1%), diabetes mellitus (30.5%), previous or current smoking (24.6%), and obesity (23%).
A total of 1683 (51.7%) patients were admitted to the ICU. By August 25th, there were 2016 (62%) discharges, 939 (28.9%) deaths, 278 (8.5%) transfers to other facilities and 21 (0.6%) patients remained hospitalized.
Cost and follow-upFor the 3254 patient admissions analyzed, there were 44,735 patient-days of hospitalization, resulting in a rate of 7.27 per 100 persons/day and a cost/rate of US$56,564.20. Fig. 1a and b show the density of the follow-up time and the total cost (US$), including the patient´s distribution. The total cost of the hospitalizations was US$41,122,173.39. The average cost per admission was US$12,637.42 (US$20,002.80 for admissions that included ICU stays at any point and US$4839.57 for those who did not), and the overall daily cost was US$919.24.
.")
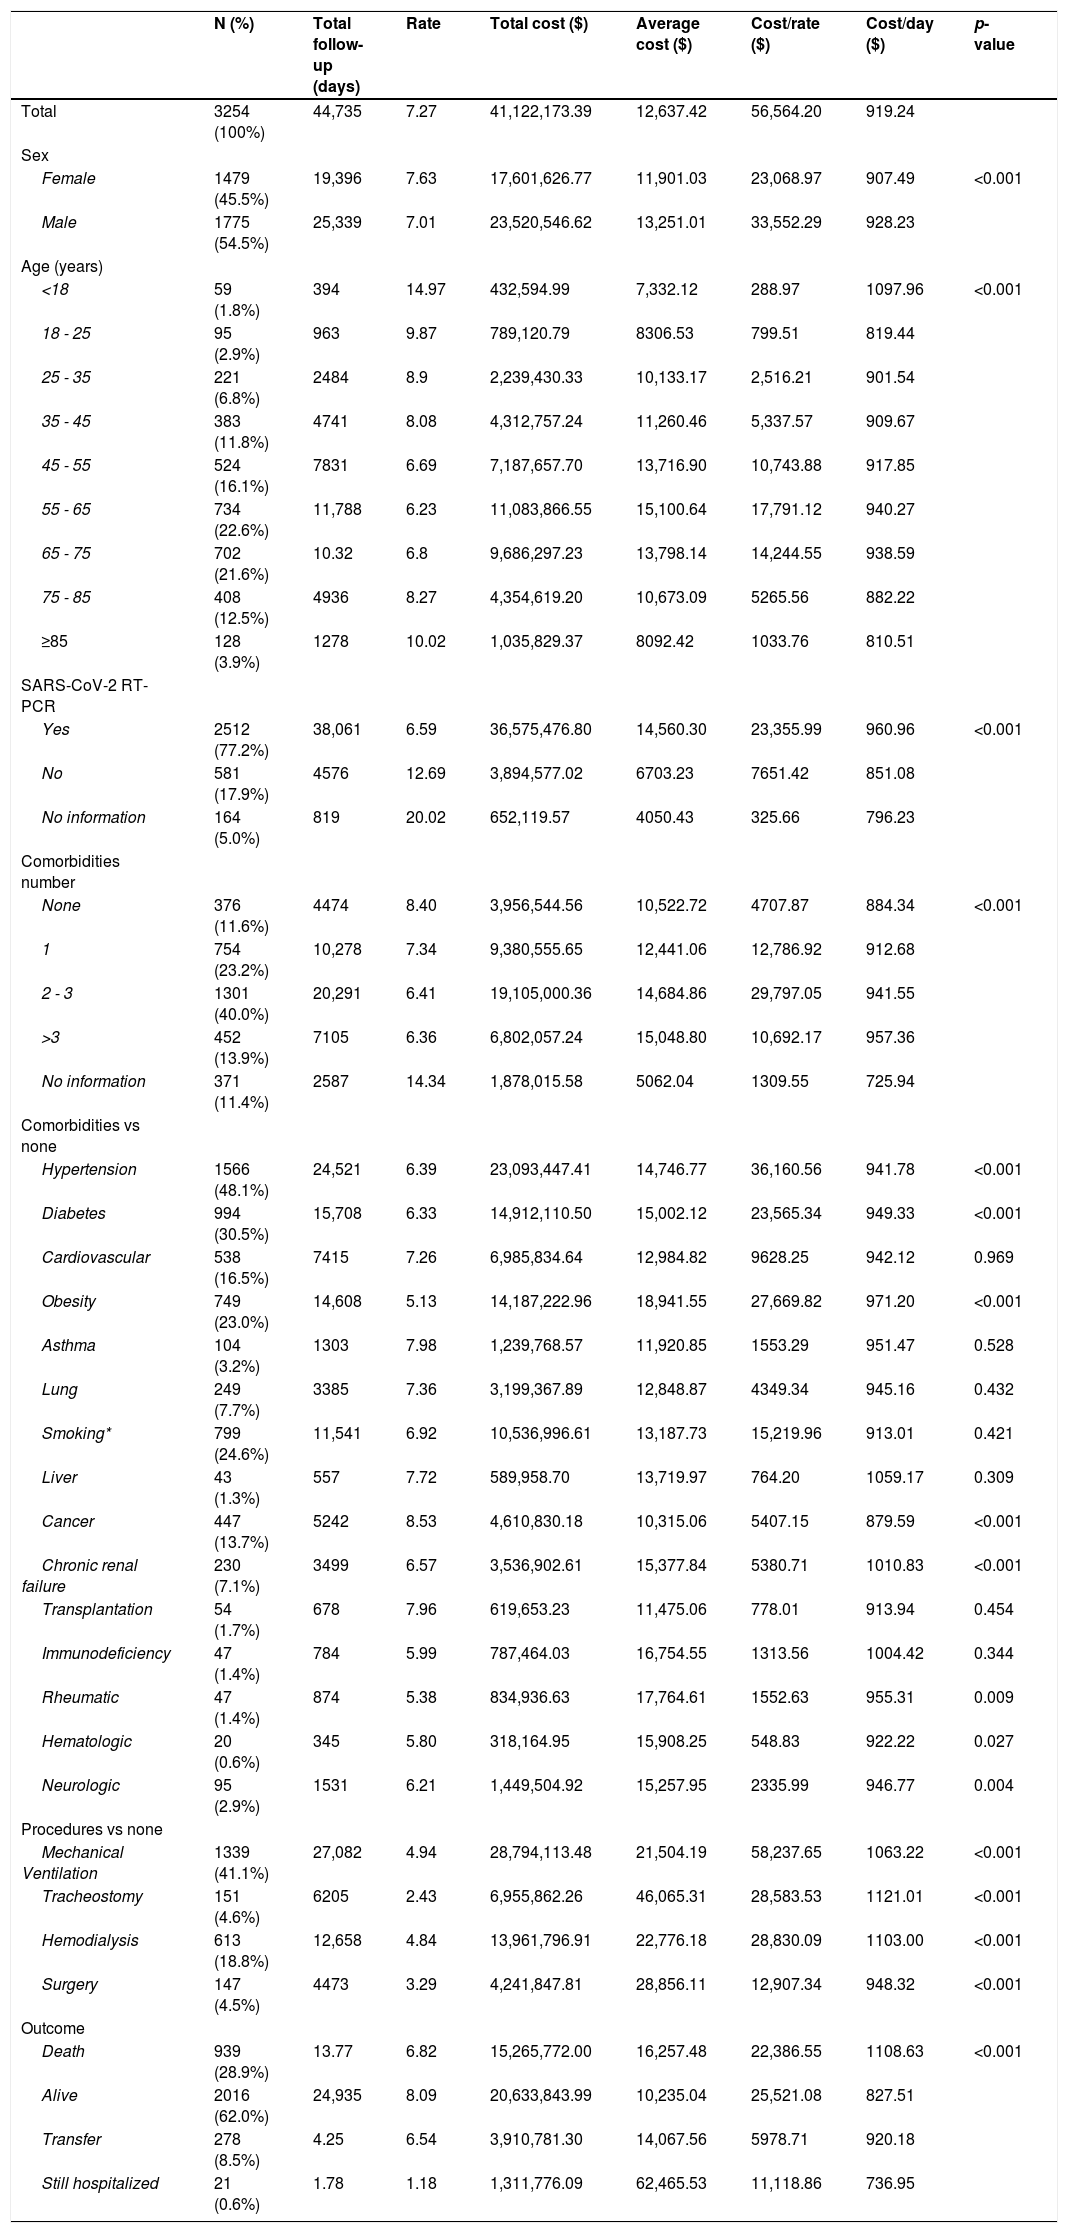
The impact of age, sex, COVID-19 confirmation, comorbidities, procedures and outcome on hospital costs generally paralleled the total LOS experienced in patient days (Table 1). Male patients were associated with a significantly greater expense (US$33,552.29 versus US$23,068.97 for females, p < 0.001). The 55- to 65-year-old age group had the greatest impact on cost, with a mean US$17,791.12 cost/rate.
Descriptive statistics, including absolute and relative frequencies, total follow-up in days, rate per 100 persons/Day, hospital total cost, average cost, cost by rate, and cost by day, according to demographics, clinical conditions, and status.
Rate x 100 persons day; *Smoking (actual or past).
#Including HIV; p-value based on Mann-Whitney U test for independent samples.
Admissions for patients with confirmed COVID-19 had higher average costs than those for patients with no confirmation of COVID-19 (US$14,560.30 versus US$6703.23, respectively). Comorbidities significantly associated with higher average costs were hypertension (US$14,746.77), diabetes (US$15,002.12), obesity (US$18,941.55), cancer (US$10,315.06), chronic renal failure (US$15,377.84), and rheumatic (US$17,764.61), hematologic (US$15,908.25) and neurologic (US$15,257.95) diseases. The presence and number of comorbidities significantly increased the average daily cost according to a dose-response relationship; patients without comorbidities had a lower cost/rate (US$884.34/day) than patients with one comorbidity (US$ 912.68/day), 2 or 3 (US$ 941.55/day) or more than 3 comorbidities (US$ 957.36/day).
Requiring additional therapeutic procedures during hospitalization, i.e., mechanical ventilation (US$ 1063.22/day), tracheostomy (US$ 1121.01/day), hemodialysis (US$ 1103.00/day) and surgery (US$ 948.32/day), was also significantly associated with higher average daily costs (overall US$919.24) than not requiring these types of procedures.
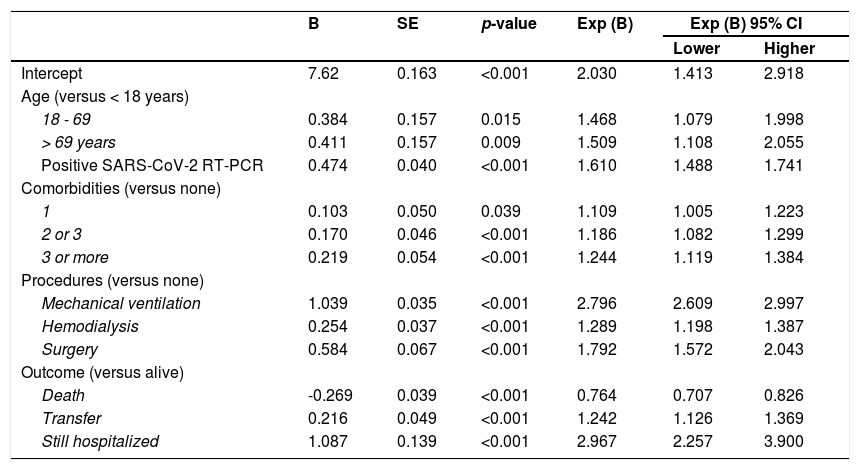
Age strata over 69 years (predicting 50% more costs) and 18-69 years (47% increase); laboratory-confirmed COVID-19 (61% higher costs); one (11%), 2 or 3 (19%) or more than 3 comorbidities (24%); and requiring mechanical ventilation (nearly 2 times more costs), dialysis (29%), surgery (79%), transfer (24%) or further hospitalization (97% higher costs) remained significantly associated with higher costs after adjustment by multiple regression analysis according to a gamma distribution. The costs of admissions with fatal outcomes were 24% lower than those with other outcomes in the adjusted analysis (Table 2). This model resulted in an overall US$1562.8 rate difference (RD) (Supplementary Figure S1).
Multiple regression model with a gamma distribution to assess the adjusted impact of clinical conditions on the total cost (US$).
Dependent variable: total cost (US$).
Variables included in the model were as follows: sex, age, positive SARS-CoV-2 RT-PCR test, comorbidities, mechanical ventilation, hemodialysis, surgery, and outcome.
B: beta; SE: standard error.
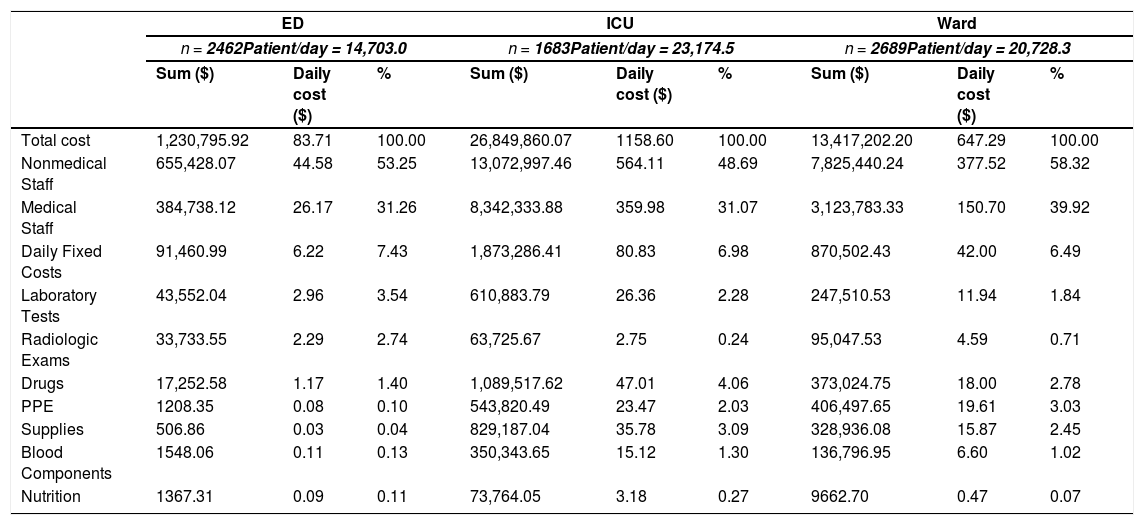
ICU stays had the highest costs (US$ 26,849,860.07; 64.7%), followed by ward (US$ 13,417,202.20; 32.3%) and ED (US$ 1,230,795; 92.3%) stays (Fig. 2a). The overhead cost of nonmedical and medical staff was the component with the highest cost for all sectors (Fig. 2b), representing 85% of the total admission costs in the ED, 82% in wards and 80% in the ICUs. In the ICUs, the other most important cost components were drugs (30.3%), supplies (23.3%) and laboratory tests (17.2%). In the wards, PPE, drugs and supplies had the highest costs (25.4%, 23.4% and 20.6%, respectively), and in the ED costs were incurred by laboratory tests, radiologic exams and drugs (43.9%, 34% and 17.4%, respectively) (Figs. 2c and d, Table 3).
 Total cost per hospital sector (US$), (b) % of cost components per sector, (c) % of other direct cost components in each sector, (d) Other cost components per sector (US$).")
Cost components and the total cost of admission in each hospital sector.
Understanding the hospital costs of COVID-19 patients is essential to evaluating the economic impact of the pandemic on healthcare, providing important information for preparedness against and response planning for future risks, and improving knowledge regarding economic evaluation of global health emergencies.1 Since a significant number of patients with COVID-19 require hospitalization,2-4 an economic evaluation from the hospital's perspective is warranted and assesses an important part of the economic impact of the COVID-19 outbreak on the healthcare system.
Herein we report an average hospital admission cost of US$12,637.42, which is almost double the China's published cost of US$6827 from 70 empirically observed cases19 but is similar to the US$12,547 reported in a study from Saudi Arabia.20 However, when interpreting average admission costs, the disease severity profile of the population must be considered. In our study, the average cost of admission was US$20,002.80 for the hospitalized patients with severe disease who were admitted to the ICU17 (who accounted for 51.7%) and US$4839.57 for the other patients. In a study of COVID-19 patients admitted to two hospitals in New York City, 22% of the patients were considered critically ill.2 The population in our study resembles this group since 41% required invasive mechanical ventilation, 19% required hemodialysis, and almost 29% resulted in death.2,5 This increased severity is due to the existing risk-stratified healthcare network that was reinforced as part of the state´s COVID-19 pandemic response, with shelter hospitals for hospitalized patients with mild disease and referral units, such as HCFMUSP, designated for patients with severe conditions. Therefore, regulators transferred critically ill COVID-19 patients and those with complex underlying conditions requiring specialized care to HCFMUSP, where the ICU capacity was increased.10,11 As expected, in our study, the highest cost/day was incurred by ICU stay.
The correlation between pre-existing health conditions, age and disease severity was established previously.21,22 Here, we describe how these variables are also related to higher costs. An increasing trend was observed with the number of comorbidities, where compared to no comorbidities (US$10,522.72), 2 or 3 comorbidities (n = 1301) elevated the average admission cost by 16%, and >3 comorbidities (n = 452) increased it by 19%. These findings are also similar to Shandong´s report, with a 40% increase in hospital admission cost for patients with any pre-existing disease.19 Laboratory confirmation of SARS-CoV-2 infection was also independently associated with higher admission costs and may be related to disease severity, with a higher viral load being present in more severe cases.23,24 Death was the admission outcome related to lower costs, probably due to limiting the LOS by occurring early in the disease course (Supplementary Figure S2).
Human resources accounted for the greatest proportion of costs in all hospital sectors. In the ED, this component substantially elevated the cost/day, which can be partly explained by the ED needing to have medical and surgical specialties available 24/7 to assist with the specific urgent needs of inpatients from all sectors. The COVID-19 pandemic response increased the need for healthcare professionals since they were essential to capacity expansion. Competitive salaries had to be paid given the limited number of professionals, and this required a 46% increase in shift wages, which also increased overhead costs.25
Analyzing the costs of COVID-19 patient admissions and comparing them to costs incurred during other epidemics puts the costs of COVID-19 hospital admissions into a historical context. The average hospital admission cost of US$12,637.42 is similar to the model means of US$12,264, which was predicted using data for severe pneumonia hospitalizations due to H1N1 in the USA,26 and US$12,947, which was based on MERS-CoV data from Saudi Arabia.20 The reported hospital costs of seasonal influenza infections are higher; a study described them to be US$34,743 for patients aged between 20 and 64 years.27 Data about other epidemics showed that the cost of treatment of patients with pertussis ranged from $412–$55528, and the estimated cost for treating 11 patients with Ebola virus disease during the 2014 outbreak in West Africa was US$1.2 million in a treatment center in the USA.29,30
Economic evaluations are usually impacted by local conditions related to resource availability and the local market. However, in the COVID-19 pandemic, some aspects were due to global concerns, such as the simultaneous worldwide need for PPE and mechanical ventilators.31 Our study reinforces the impact of PPE on costs, as they totaled US$951,526.50.
Despite being a population with a high proportion of critically ill patients and some of them with complex underlying conditions, analyzing the costs of a large hospital sample according to detailed patient clinical and demographic characteristics makes it possible to apply this analysis to other populations and to other hospital settings since critically ill patients requiring mechanical ventilation, for example, were extensively present worldwide.2-4 In addition, the centralization of care in a single institute where no other disease was being treated during the study period ensured that the cost analysis of these admissions was precise, homogeneous and less subject to errors.
The UHS is known to be underfinanced, with gaps between the amount paid to providers and hospital costs.32 During the pandemic, hospital capacity expansion and treatment of patients with COVID-19 required additional financing,25 which could be described and analyzed in future studies since it was not the focus of our study.
Our study has some limitations since it took place in a single quaternary reference center, which could limit its generalizability, and was performed from the hospital perspective, excluding indirect costs and additional investment in fixed capacity expansion and equipment acquisition. No sensitivity analysis was performed, which limits the comparison of cost components to the few studies available to date about COVID-19 hospital costs. However, the study findings were analyzed with established, standardized, reproducible methods with the aim of supporting referral hospitals’ emergency preparedness. Therefore, the prospective collection of detailed clinical data, sector itineraries, outcomes, resources used and costs for a large sample of patient hospitalizations are strengths of this study and make the results applicable to other populations and settings.
ConclusionIn this single quaternary reference center, human resources accounted for the largest cost component, and ICUs accounted for the costliest sector. Total costs and average and daily estimated costs increased by 50% for older age strata, by 10-24% according to the number of comorbidities and by 24%-200% when additional therapeutic procedures were required; these costs decreased by 24% when the outcome was death.
Understanding the hospital costs related to COVID-19 admission and the economic impact of the disease across different population subgroups can support health policy makers in developing a comprehensive approach to hospital preparedness, decision-making and planning for future risk management.
Role of the funding sourceThis study was conducted without funding.
Data availability statementDeidentified participant data and a data dictionary defining each field in the set will be made available on request. They will be sent by the corresponding author after approval of a proposal with a signed data access agreement. Data will be available on publication.
FundingThis research did not receive any specific grant from funding agencies in the public, commercial, or not-for-profit sectors.
EPICCoV Study Group, COVID Registry Group, Alessandra Pereira, Francis Mironescu Tomazini, Claudia Maria Montebello de Oliveira, Givaldo Oliveira de Souza, Ligia Maria Dal Secco.
HCFMUSP Covid-19 Study Group members: Eloisa Bonfa, Edivaldo M. Utiyama, Aluisio C. Segurado, Beatriz Perondi, Amanda C. Montal, Leila Harima, Solange R.G. Fusco, Rosemeire K. Hangai, Marjorie F. Silva, Marcelo C. Rocha, Lucila Pedroso, Marcelo C.A. Ramos, Danielle P. Moraes, Renato Madrid Baldassare, Izabel Marcilio, Izabel Cristina Rios, Antonio José Pereira, Elizabeth de Faria, Fabiane Yumi Ogihara Kawano, Maria Amélia de Jesus, Gisele Pereira, Esper Kallas, Maria Cristina Peres Braido Francisco, Carolina Mendes do Carmo, Clarice Tanaka, Heraldo Possolo de Souza, Julio F.M. Marchini, Carlos R.R. Carvalho, Juliana C. Ferreira, Anna Sara Shafferman Levin, Maura Salaroli Oliveira, Thaís Guimarães, Carolina dos Santos Lázari, Alberto José da Silva Duarte, Ester Sabino, Marcello M.C. Magri, Yeh-Li Ho, Bruno A.M.P. Besen, Luiz Marcelo Malbouisson, Rodrigo Antonio Brandão Neto, Sabrina C.C. Ribeiro, Suze M. Jacon, Ana Catharina S.S. Nastri, Thaís L. Bastos, Gerhard da Paz Lauterbach, Rodrigo H. Kondo, Tarcisio E.P. Barros-Filho.
