


This study compares the effects of virus-cell interactions among SARS-CoV-2 variants of concern (VOCs) isolated in Brazil in 2021, hypothesizing a correlation between cellular alterations and mortality and between viral load and transmissibility. For this purpose, reference isolates of Alpha, Gamma, Zeta, and Delta variants were inoculated into monolayers of Vero-E6 cells. Viral RNA was quantified in cell supernatants by RT‒PCR, and infected cells were analyzed by Transmission Electron Microscopy (TEM) for qualitative and quantitative evaluation of cellular changes 24, 48, and 72 hours postinfection (hpi). Ultrastructural analyses showed that all variants of SARS-CoV-2 altered the structure and function of mitochondria, nucleus, and rough endoplasmic reticulum of cells. Monolayers infected with the Delta variant showed the highest number of modified cells and the greatest statistically significant differences compared to those of other variants. Viral particles were observed in the cytosol and the cell membrane in 100 % of the cells at 48 hpi. Alpha showed the highest mean particle diameter (79 nm), and Gamma and Delta were the smallest (75 nm). Alpha and Gamma had the highest particle frequency per field at 48 hpi, while the same was observed for Zeta and Delta at 72 hpi and 24 hpi, respectively. The cycle threshold of viral RNA varied among the target protein, VOC, and time of infection. The findings presented here demonstrate that all four VOCs evaluated caused ultrastructural changes in Vero-E6 cells, which were more prominent when infection occured with the Delta variant.
The history of COVID-19 started as a cluster of patients with pneumonia of unknown cause in Wuhan, China.1 As of 30 October 2023, there have been 771,549,718 confirmed cases of COVID-19 worldwide, including 6,9574,473 deaths, reported to the World Health Organization.2 Despite the significant impact of COVID-19 on public health and the global economy, the increasing environmental imbalance forces humanity to face more challenges related to infectious diseases.3
The etiological agent, SARS-CoV-2, is an enveloped, linear, single-stranded, and positive sense RNA virus, classified into the Coronaviridae family.4 This virus has a much lower mutation rate than other previous pandemic viruses, such as HIV and influenza. However, even in 2020 (first year of the pandemic) there were already more than 12,000 registers of mutations worldwide. Most were related to the genetic sequence that encodes the spike protein.5 Furthermore, an analysis of 10,287,271 SARS-CoV-2 genome sequences from GISAID databases, from February 24, 2020, to April 2022, found that 65.37 % of the samples had up to three mutations in the genomic sequence that codes for the Spike protein, and 29.79 % had four or more.6
This phenomenon caused the emergence of different viral variants, and the World Health Organization classified them as Variants of Concern (VOCs) and variants of interest (VOIs).7 VOI are those which pose a potential extra risk to public health, and VOCs cause infections with worse prognosis. Variants classified as VOC present changes in their sequences that may result in less affinity of antibodies mounted for older strains, higher mortality rates, and losses in diagnostic sensitivities.8 The first VOC that emerged was Alpha, followed by Beta, Gamma, Delta, and Omicron. In Brazil, the VOI Zeta also had an enormous epidemiological impact.9
Regarding VOCs, the first of them (Alpha) was detected in the UK in September 2020. It has 23 mutations compared to the ancestral strain.10 The N501Y variant increased binding affinity for ACE2 10-fold and viral load fourfold and made this variant 50 % to 80 % more contagious than the ancestral strain.11 Fatal cases also increased by approximately 55 %.12 However, antibodies against the original SARS-CoV-2 prevented severe and fatal disease cases after infection by the Alpha variant.13
The Gamma variant (P.1) was first detected in four travelers returning to Japan from Amazonas state on 2 January 202114 and was soon recognized as an emergent lineage in the Brazilian state of Manaus.15 Its binding affinity with the ACE2 receptor was five times higher than that of the ancestral strain.16 In Brazil, the Gamma variant (P.1) was responsible for the highest number of fatal cases, in addition to being accountable for episodes of reinfection in the state of São Paulo and the second wave of infections all over Brazil.17,18
The Delta variant appeared in India in October 2020.19 This VOC generates a higher viral load (a thousand times greater than the ancestral strain) and has a shorter incubation period, which favors its dispersion.20 In the UK, for example, it was the strain causing the third wave of COVID-19 cases. This occurred because Delta is 60 % more transmissible than the alpha variant.21 Delta has better binding affinity with the ACE2 receptor and enters the cell easily. Another critical point is the reduction of antibody titers in vaccinated individuals by up to 20 times, which is an important mechanism to evade the immune response.22
The VOI Zeta (P.2) was first detected in the Brazilian state of Rio de Janeiro in October 2020 and was detected in 45 % of the samples tested in February 2021 during epidemiological surveillance actions.23,24 Cases involving this variant spread fast to several American countries.24 The E484K mutation allowed better interaction of the virus with the ACE-2 receptor, acting in the escape of neutralizing antibodies, and reducing the efficiency of neutralizing human antibodies.24,25 This would explain the strong association of the Zeta variant (P.2) with cases of reinfection in Brazil.26,27
Most data about these variants are fragmented in the literature, and few studies have compared the cytopathological effects of different variants in vitro.28,29 Considering that new variants continue to emerge (including possible new VOC strains), some of them could escape the immune response conferred by vaccination, induce severe clinical manifestations or be more transmissible. Understanding the differences in virus-cell interactions between the different variants of SARS-CoV-2 is crucial for better to understanding the infection profile in the human population and contributing data for preclinical studies.
A previous study reported that the Alpha, Beta and Gamma variants had similar replication in Vero-E6 cells. For the Delta variant, however, virion production was ten times lower. Furthermore, when very low MOI values were used, cytopathological effects (such as the presence of cells rounded, sloughed, or lysed and detached from the surface of the cell culture flask) occurred for the Alpha, Gamma, and Delta variants after 56 h of inoculation.30 These data suggest that the large difference in affinity for ACE2 receptors between different VOCs does not decisively influence viral replication and cell damage.
Finally, techniques such as Transmission Electron Microscopy (TEM) are essential for the morphological characterization of virus-cell interactions. TEM does not require pathogen-specific reagents, nor is it limited by the type of biological sample analyzed.31 From this perspective, this work aimed to infect Vero-E6 lineage cells with variants of epidemiological importance in Brazil to characterize the effects of virus-cell interactions through the TEM technique.
Materials and methodsVirus sampleEligible clinical samples that tested positive for SARS-CoV-2 by RT-qPCR were submitted to virus isolation in Vero-E6 cell monolayers at a biosafety level 3 laboratory. Briefly, 200 µL of respiratory samples, such as nasopharyngeal swabs, were inoculated into cell flasks. Monolayers were inspected daily by an inverted microscope for the presence of Cytopathic Effects (CPEs) for up to four days. Virus isolation was attempted in a maximum of three consecutive blind passages. Overall, CPE was initially observed on the second day postinfection (dpi), and viral harvest was performed at the fourth dpi. Samples that presented CPE had supernatants aliquoted and tested by RT‒qPCR followed by nucleotide sequencing. Whole genomes were sequenced by an Illumina COVIDSeq test kit for lineage confirmation, as previously described32. The genomic analysis was performed with ViralFlow v.1.0.0.0 for all virus isolates. Only genomes with more than 95 % coverage breadth were considered for the panel of reference isolates. After virus propagation, the sequence was compared to the respective clinical samples to determine the isolates used in this study. Once confirmed, the consensus sequences were deposited in the EpiCoV database on the GISAID website (www.gisaid. org). One sample of each SARS-CoV-2 was sequentially titrated by plaque assay to form a lineage bank with reference isolates. A panel of reference isolates, including the VOCs Gamma (hCoV-19/Brazil/AMFIOCRUZ-3521–1P/2021, EPI_ISL_1,402,431), Alpha (hCoV-19/Brazil/ RJ-FIOCRUZ-2624–1P/2021, EPI_ISL_1,402,430), Delta (hCoV-19/Brazil/MA-FIOCRUZ-25,688–2P/2021, EPI_ISL_2,645,417), and VOI Zeta (hCoV-19/Brazil/AL- FIOCRUZ-30,270–1P/2020, EPI_ISL_2,645,635) were selected for the experiments performed in this study. VOC and VOI reference isolates were chosen because of their local and global epidemiological impact11. According to their availability in our lineage bank of reference isolates, the biological characterization was performed as previously described32.
Cells and virus infectionVero-E6 cultures were maintained at 37 °C and 5 % CO2 in DMEM (Dulbecco's modified Eagle's medium) supplemented with 2 % Fetal Bovine Serum (FBS) and 100 U/mL Penicillin-Streptomycin (Pen-Strep). For infection, monolayers were washed twice with Phosphate-Buffered Saline (PBS) and then inoculated with the Multiplicity of Infection (MOI) of 0.01 in nonsupplemented DMEM in a Biosafety Level 3 facility. Cell cultures were incubated for one h at 37 °C and 5 % CO2 for virus adsorption. After adsorption, the inoculum was removed, and the cells were again incubated for 72 h under the same conditions. The same pattern of both the cultivation and maintenance of the cells and the infection was applied for all SARS-CoV-2 variants. Noninfected cultures were used as cell control. Supernatants and cell suspensions were collected at 24, 48 and 72 hpi. RNA extraction, RT‒qPCR and ultrastructural analysis by TEM were conducted as described below.
RT‒qPCR for SARS-CoV-2Supernatants from cultured cells at 24, 48, and 72 hpi were harvested for RNA extraction. Total RNA was extracted using the QIAmp Viral RNA kit (Qiagen). Purified RNA was submitted to Real-time Reverse Transcription Polymerase Chain Reaction (RT‒qPCR) with probes targeting the genes encoding the Envelope protein (E); Nucleocapsid (N), and human constitutive gene-RNAse P (RP). Reactions were performed with Molecular KIT SC2 (E/N) using a Biomanguinhos RT-PCR kit (Biomanguinhos). Experiments were performed in triplicate.
Transmission electron microscopy (TEM)For TEM analysis, cell suspensions were fixed in 2.5 % glutaraldehyde in sodium cacodylate buffer (0.2 M, pH 7.2) were postfixed in 1 % buffered osmium tetroxide, dehydrated in acetone, embedded in epoxy resin, and polymerized at 60 °C over three days.33 Ultrathin sections (50–70 nm) were obtained from the resin blocks. The sections were picked up using copper grids (300 mesh and no coating) and observed using a Hitachi HT 7800 (Hitachi, Tokyo, Japan) transmission electron microscope.
Quantitative analysis of particles of SARS-CoV-2 Alpha, Gamma, Zeta, and Delta variants in Vero-E6 cellsViral particles attached to the cell membrane and within the cytosol were counted at 24, 48, and 72 hpi, in five microscopic fields (magnification = x4.0k), for each variant of SARS-CoV-2 and point of experimental kinetics. Only one researcher quantified the viruses in all images of these fields using ImageJ (NIH) software. Then, the frequencies found in each variant were compared through the points of the kinetics using the Kruskal–Wallis test. The statistical significance adopted was p < 0.05. Microsoft Excel software was used to build the charts, and BioEstat 5.3 performed the statistical analysis.
Quantitative analysis of cytopathology resulting from infection of Vero-E6 cells with SARS-CoV-2 Alpha, Gamma, Zeta, and Delta variantsInfected cells were analyzed at 24, 48, and 72 hpi. For each variant and time of infection, 20 cells from the same sample were analyzed, aiming to detect the following changes: mitochondrial and nuclear alteration, thickening of the Rough Endoplasmic Reticulum (RER), proliferation of Double-Membrane Vesicles (DMVs), electron-dense ribosomes, presence of myelin figures, lipid droplet accumulation, filopodia and microvilli in the cell membrane, formation of syncytia, and virus particles in the cytosol and on the cell membrane. Only one researcher performed this entire procedure and considered only entirely visible cells (i.e., cells without parts covered by grid meshes).
Statistical analysis was performed based on the number of evaluated cells (n = 20 for each group) and the expected frequencies of cytopathological effects, calculated using the observed frequencies. Afterward, Fisher's exact test was applied to contingency tables containing these data to assess the significance of possible associations between SARS-CoV-2 variants and ultrastructural alterations. The software GraphPad Prism version 8.0.1 (GraphPad Software Inc., La Jolla, San Diego, CA, USA) was used for the statistical analysis, and for all evaluations, the significance level was set as p < 0.05.
Measurement of virus particle sizeThe images were collected in a Hitachi HT 7800 (Hitachi, Tokyo, Japan) transmission electron microscope. The particle size statistical analysis was performed using ImageJ software. For each variant, the diameter of 200 virus particles was manually gauged. Only particles attached to the cell membrane were considered. The values obtained from all images were then grouped by variant, and the mean value was calculated. The morphometry data were compiled in Microsoft Excel software.
ResultsUltrastructural alterations of Vero-E6 cells infected with SARS-CoV-2 variantsCells infected with Alpha, Gamma, Zeta, and Delta presented several alterations at all time points of the kinetics (24, 48, and 72 hpi) compared to those in uninfected cells (Fig. 1). The main changes observed were mitochondrial swelling and vacuolization and disorganization of mitochondrial crests (Fig. 2), pyknotic nuclei and some nuclei presenting chromatin condensation (Fig. 3), thickening of the RER (Fig. 4), proliferation of Double-Membrane Vesicles (DMVs) (Fig. 5) and lipid droplets (Fig. 6), electron-dense ribosomes (Fig. 7), presence of myelin figures (Fig. 8), filopodia and microvilli on the cell membrane (Fig. 9) and syncytia formation (Fig. 10). The virus particles were commonly observed inside the cytosol, vesicles, and on the cell membrane (Fig. 11); viral particles associated with filopodia, and microvilli were observed.
, values referring to noninfected cells (-), Mitochondrial alteration, Nuclear alteration, Thickening of the rough endoplasmic reticulum, Proliferation of double membrane vesicles, Electron-dense ribosomes, Myelin figures, Lipid droplet accumulation, Filopodia/microvilli on the cell membrane, Syncytia, Virus inside the cytosol, Virus on the cell membrane.")
Graphical representation of the quantitative cytopathology studies of Vero-E6 cells infected with SARS-CoV-2 variants. Hours post infection (hpi), values referring to noninfected cells (-),
Mitochondrial alteration, Nuclear alteration, Thickening of the rough endoplasmic reticulum, Proliferation of double membrane vesicles, Electron-dense ribosomes, Myelin figures, Lipid droplet accumulation, Filopodia/microvilli on the cell membrane, Syncytia, Virus inside the cytosol, Virus on the cell membrane.


 (A), Vero-E6 cell 48 hpi with Gamma (B), and Alpha (C) and 24 hpi with Zeta (D) and Delta (E). Mitochondrial vacuolization (B‒E) and disorganization of mitochondrial crests (E). Mitochondria (black arrow), SARS-CoV-2 particles (white arrows). TEM images.")
Mitochondrial ultrastructural alterations of Vero-E6 cells infected with SARS-CoV-2 variants. Uninfected Vero-E6 cell at 24 h of cultivation (control cell) (A), Vero-E6 cell 48 hpi with Gamma (B), and Alpha (C) and 24 hpi with Zeta (D) and Delta (E). Mitochondrial vacuolization (B‒E) and disorganization of mitochondrial crests (E). Mitochondria (black arrow), SARS-CoV-2 particles (white arrows). TEM images.
![Nuclear alterations in Vero-E6 cells infected with SARS-CoV-2 variants. Control (uninfected) Vero-E6 cell [A], nuclei presenting changes in chromatin profile [B, C, E]), and pyknotic nuclei [D]). Uninfected Vero-E6 cell at 24 h of cultivation [A]. Vero-E6 cells infected with Alpha (48 hpi [B] and 72 hpi [E]), Gamma (72 hpi [C]) and Zeta (24 hpi [D]). Nucleus (N). TEM images.](https://static.elsevier.es/multimedia/14138670/0000002800000001/v2_202403200547/S1413867023009662/v2_202403200547/en/main.assets/gr3.jpeg?xkr=ue/ImdikoIMrsJoerZ+w9/qSCRz5Ib+l7k+w1jVIYLy+x9hT2kumM6W8qgi/U+qBPINCCw2U5cEUQ2m2k9UaaS/sd4R1yKdWwGnpKgppRgNDWiF2LaQ+GrVfnH7jDShdjw8OxbYEHK1dTA+EMRBGMLsF4DcAq3mF4FMCyV5I9QQ6jiFqmxvoU9GUXxbbn5qO4OFJVvUaYQMJNM0sEZAa+IhS7cxVqOz0zpoKO1QeGNKgKGfXmFBkgdTZUcbZLoJcIxKKVG9zUoSy3GVUtNQbE5udVuAoO9o6gkgYbe2GuPg= "Nuclear alterations in Vero-E6 cells infected with SARS-CoV-2 variants. Control (uninfected) Vero-E6 cell [A], nuclei presenting changes in chromatin profile [B, C, E]), and pyknotic nuclei [D]). Uninfected Vero-E6 cell at 24 h of cultivation [A]. Vero-E6 cells infected with Alpha (48 hpi [B] and 72 hpi [E]), Gamma (72 hpi [C]) and Zeta (24 hpi [D]). Nucleus (N). TEM images.")
Nuclear alterations in Vero-E6 cells infected with SARS-CoV-2 variants. Control (uninfected) Vero-E6 cell [A], nuclei presenting changes in chromatin profile [B, C, E]), and pyknotic nuclei [D]). Uninfected Vero-E6 cell at 24 h of cultivation [A]. Vero-E6 cells infected with Alpha (48 hpi [B] and 72 hpi [E]), Gamma (72 hpi [C]) and Zeta (24 hpi [D]). Nucleus (N). TEM images.
 in Vero-E6 cells infected with SARS-CoV-2 variants (B‒E). (A) Uninfected cell at 24 h of cultivation (cell control) (no RER thickening). (B) Cell 24 hpi with Gamma. (C) Cell 48 hpi with Alpha. (D) Cell 24 hpi with Zeta. (E) Cell 24 hpi with Delta. SARS-CoV-2 particles (white arrows). Nucleus (N). TEM images.")
Thickening of the Rough Endoplasmic Reticulum (RER) in Vero-E6 cells infected with SARS-CoV-2 variants (B‒E). (A) Uninfected cell at 24 h of cultivation (cell control) (no RER thickening). (B) Cell 24 hpi with Gamma. (C) Cell 48 hpi with Alpha. (D) Cell 24 hpi with Zeta. (E) Cell 24 hpi with Delta. SARS-CoV-2 particles (white arrows). Nucleus (N). TEM images.
 in Vero-E6 cells infected with SARS-CoV-2 variants. (A) Cell 24 hpi with Gamma. (B) Cell 48 hpi with Zeta. (C) Cell 48 hpi with Alpha. (D) Cell 48 hpi with Delta. SARS-CoV-2 particles (white arrows). Nucleus (N). TEM images.")
 in Vero-E6 cells infected with SARS-CoV-2 variants. (A) Cell 72 hpi with Gamma. (B) Cell 48 hpi with Zeta. (C) Cell 72 hpi with Alpha. (D) Cell 48 hpi with Delta. SARS-CoV-2 particles (white arrows). Nucleus (N). TEM images.")
 Cell 24 hpi with gamma. (B) Cell 48 hpi with Zeta. (C) Cell 72 hpi with Alpha. (D) Cell 48 hpi with Delta. SARS-CoV-2 particles (white arrows). Nucleus (N). TEM images.")
 in Vero-E6 cells infected with SARS-CoV-2 variants at 48 hpi (A: Gamma, B: Alpha), 72 hpi (C: Zeta) and 24 hpi (D: Delta). SARS-CoV-2 particles (white arrows). Nucleus (N). TEM images.")
 in Vero-E6 cells infected with SARS-CoV-2 variants Gamma (A) and Alpha (B) at 48 hpi and Zeta (C) and delta (D) at 72 and 24 hpi, respectively. SARS-CoV-2 particles (white arrows). Nucleus (N). TEM images.")
 Vero-E6 cells 48 hpi with the Gamma variant. (B) Vero-E6 cell 48 hpi with Zeta variant. (C) Vero-E6 cells 48 hpi with Alpha variant. (D) Vero-E6 cells 24 hpi with Delta variant. SARS-CoV-2 particles (white arrows), nucleus (N). TEM images.")
 and on the cell membrane (black arrow) of Vero-E6 cells. (A) Cell 48 hpi with Gamma. (B) Cell 48 hpi with Zeta. (C) Cell 48 hpi with Alpha. (D) Cell 48 hpi. with Delta. Nucleus (N). TEM images.")
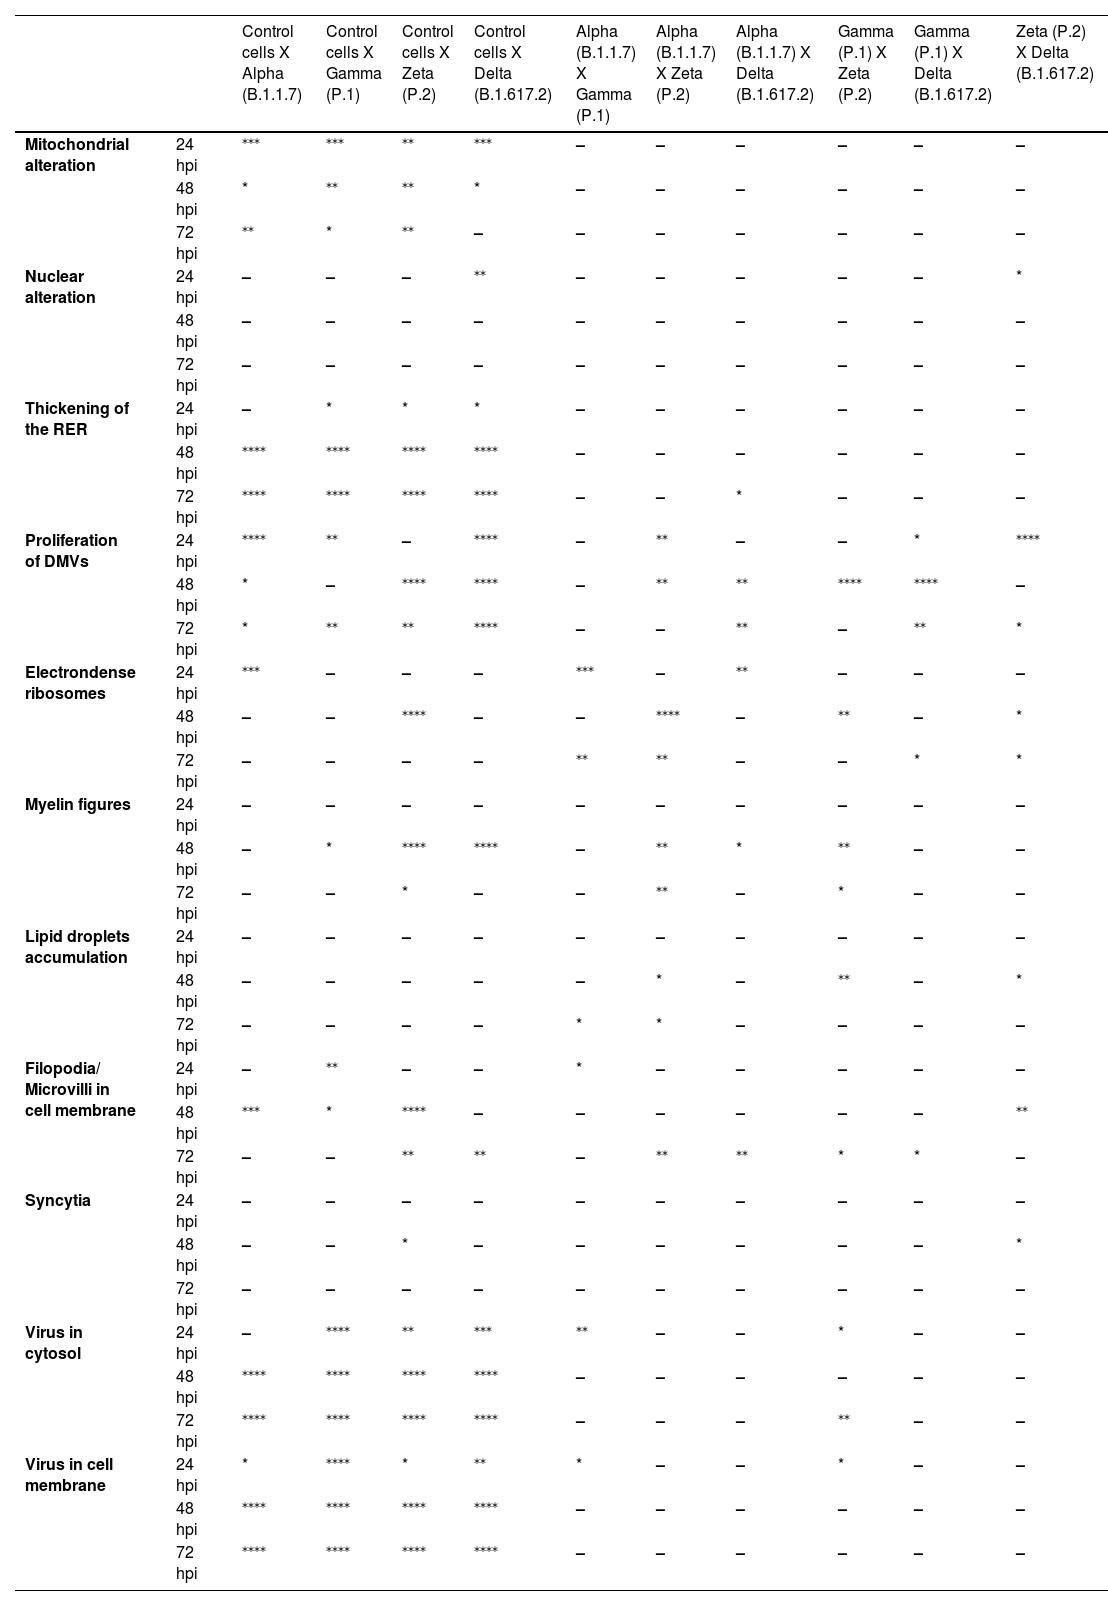
Not considering the timing of the kinetics, although the variant that was associated with the highest number of altered cells was Delta (Fig. 1), Zeta had more alterations considered significantly different, either compared with those of control cells or the other variants, according to Fisher's exact test (Table 1). Our quantitative cytopathology studies showed that the change presenting the highest frequency, regardless of the kinetics time and variant used for infection, was mitochondrial-related, such as its thickening and vacuolization (Fig. 1). In addition to the mitochondrial alterations, other changes were observed in more than half of the cells analyzed.
Statistical analysis of cytopathological effects in Vero-E6 cells infected with SARS-CoV-2 variants Alpha, Gamma, Zeta and Delta.
| Control cells X Alpha (B.1.1.7) | Control cells X Gamma (P.1) | Control cells X Zeta (P.2) | Control cells X Delta (B.1.617.2) | Alpha (B.1.1.7) X Gamma (P.1) | Alpha (B.1.1.7) X Zeta (P.2) | Alpha (B.1.1.7) X Delta (B.1.617.2) | Gamma (P.1) X Zeta (P.2) | Gamma (P.1) X Delta (B.1.617.2) | Zeta (P.2) X Delta (B.1.617.2) | ||
|---|---|---|---|---|---|---|---|---|---|---|---|
| Mitochondrial alteration | 24 hpi | ⁎⁎⁎ | ⁎⁎⁎ | ⁎⁎ | ⁎⁎⁎ | – | – | – | – | – | – |
| 48 hpi | * | ⁎⁎ | ⁎⁎ | * | – | – | – | – | – | – | |
| 72 hpi | ⁎⁎ | * | ⁎⁎ | – | – | – | – | – | – | – | |
| Nuclear alteration | 24 hpi | – | – | – | ⁎⁎ | – | – | – | – | – | * |
| 48 hpi | – | – | – | – | – | – | – | – | – | – | |
| 72 hpi | – | – | – | – | – | – | – | – | – | – | |
| Thickening of the RER | 24 hpi | – | * | * | * | – | – | – | – | – | – |
| 48 hpi | ⁎⁎⁎⁎ | ⁎⁎⁎⁎ | ⁎⁎⁎⁎ | ⁎⁎⁎⁎ | – | – | – | – | – | – | |
| 72 hpi | ⁎⁎⁎⁎ | ⁎⁎⁎⁎ | ⁎⁎⁎⁎ | ⁎⁎⁎⁎ | – | – | * | – | – | – | |
| Proliferation of DMVs | 24 hpi | ⁎⁎⁎⁎ | ⁎⁎ | – | ⁎⁎⁎⁎ | – | ⁎⁎ | – | – | * | ⁎⁎⁎⁎ |
| 48 hpi | * | – | ⁎⁎⁎⁎ | ⁎⁎⁎⁎ | – | ⁎⁎ | ⁎⁎ | ⁎⁎⁎⁎ | ⁎⁎⁎⁎ | – | |
| 72 hpi | * | ⁎⁎ | ⁎⁎ | ⁎⁎⁎⁎ | – | – | ⁎⁎ | – | ⁎⁎ | * | |
| Electrondense ribosomes | 24 hpi | ⁎⁎⁎ | – | – | – | ⁎⁎⁎ | – | ⁎⁎ | – | – | – |
| 48 hpi | – | – | ⁎⁎⁎⁎ | – | – | ⁎⁎⁎⁎ | – | ⁎⁎ | – | * | |
| 72 hpi | – | – | – | – | ⁎⁎ | ⁎⁎ | – | – | * | * | |
| Myelin figures | 24 hpi | – | – | – | – | – | – | – | – | – | – |
| 48 hpi | – | * | ⁎⁎⁎⁎ | ⁎⁎⁎⁎ | – | ⁎⁎ | * | ⁎⁎ | – | – | |
| 72 hpi | – | – | * | – | – | ⁎⁎ | – | * | – | – | |
| Lipid droplets accumulation | 24 hpi | – | – | – | – | – | – | – | – | – | – |
| 48 hpi | – | – | – | – | – | * | – | ⁎⁎ | – | * | |
| 72 hpi | – | – | – | – | * | * | – | – | – | – | |
| Filopodia/ Microvilli in cell membrane | 24 hpi | – | ⁎⁎ | – | – | * | – | – | – | – | – |
| 48 hpi | ⁎⁎⁎ | * | ⁎⁎⁎⁎ | – | – | – | – | – | – | ⁎⁎ | |
| 72 hpi | – | – | ⁎⁎ | ⁎⁎ | – | ⁎⁎ | ⁎⁎ | * | * | – | |
| Syncytia | 24 hpi | – | – | – | – | – | – | – | – | – | – |
| 48 hpi | – | – | * | – | – | – | – | – | – | * | |
| 72 hpi | – | – | – | – | – | – | – | – | – | – | |
| Virus in cytosol | 24 hpi | – | ⁎⁎⁎⁎ | ⁎⁎ | ⁎⁎⁎ | ⁎⁎ | – | – | * | – | – |
| 48 hpi | ⁎⁎⁎⁎ | ⁎⁎⁎⁎ | ⁎⁎⁎⁎ | ⁎⁎⁎⁎ | – | – | – | – | – | – | |
| 72 hpi | ⁎⁎⁎⁎ | ⁎⁎⁎⁎ | ⁎⁎⁎⁎ | ⁎⁎⁎⁎ | – | – | – | ⁎⁎ | – | – | |
| Virus in cell membrane | 24 hpi | * | ⁎⁎⁎⁎ | * | ⁎⁎ | * | – | – | * | – | – |
| 48 hpi | ⁎⁎⁎⁎ | ⁎⁎⁎⁎ | ⁎⁎⁎⁎ | ⁎⁎⁎⁎ | – | – | – | – | – | – | |
| 72 hpi | ⁎⁎⁎⁎ | ⁎⁎⁎⁎ | ⁎⁎⁎⁎ | ⁎⁎⁎⁎ | – | – | – | – | – | – |
Fisher's exact test: - p > 0.05 /.
Not considering the timing of the kinetics, the variant that caused the highest number of altered cells was Delta, followed by Zeta. Regarding the analyses for the presence of viral particles within the cytosol, at 48 h, regardless of the infection variant, there was 100 % detection, and in more than half of cells at 72 hpi. The same detection profile was observed during the analyses of the virus particles attached to the cell membrane.
Syncytium formation and nuclear alteration were rarely observed, which was mostly observed in cells infected with Delta. Among all variants, the time of infection in which the most cellular alterations were concomitantly observed was 48 hpi. More than half of the uninfected cells showed the formation of myelin figures (at 24 hpi) and electron-dense ribosomes (at 72 hpi).
SARS-CoV-2 variant particle diameter analysisThe mean diameters of SARS-CoV-2 variant particles attached to the Vero-E6 cell membrane were Alpha 79 nanometers, Gamma 75 nanometers, Zeta 76 nanometers and Delta 75 nanometers. The morphological study by TEM showed spherical particles exhibiting spikes on their envelopes (Fig. 11).
Quantitative analysis of SARS-CoV-2 variant particlesThe total number of particles per microscopic field was compared between different the SARS-CoV-2 variants. For each variant, counting was performed in five areas. Variants Alpha and Gamma showed the highest number of particles at 48 hpi. The Zeta and Delta variants showed the highest counts at 72 and 24 hpi, respectively (Fig. 12A‒C). The variant with the highest number of particles was Gamma at 48 hpi. The difference between Gamma and the other variants was statistically relevant at 24 hpi (p < 0,05) as determined by the Kruskal-Wallis test.
Detection and quantification of SARS-CoV-2 E and N proteins by RT‒QPCR. Hours post infection (hpi).")
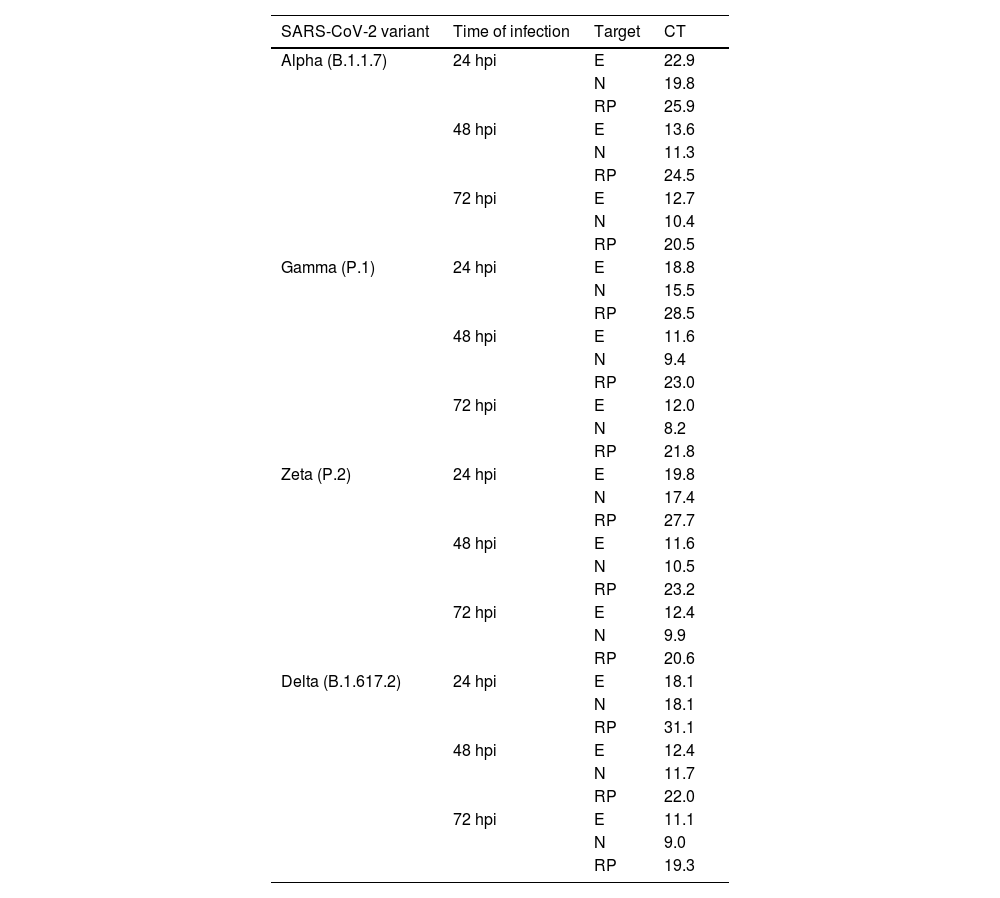
The E and N proteins of SARS-CoV-2 were detected from the supernatants of the infected cells at all kinetics times and independent of the variant of infection (Table 2).
Quantification of SARS-CoV-2 E and N proteins by RT‒qPCR in the supernatant of Vero-E6 cells infected with Alpha, Gamma, Zeta, and Delta in different times of infection.
E, Envelope protein; N, Nucleocapsid protein; hpi, Hours postinfection; RP, RNase P; CT, Cycle Threshold.
Regarding quantification, supernatants from monolayers infected with Gamma and Zeta variants showed lower CT values for E protein at 48 hpi (11.6 and 11.5, respectively), while for Alpha and Delta, the lowest values were observed at 72 hpi (12.6 and 11.1, respectively). For N protein quantification, the lowest values were observed at 72 hpi independent of the infection variant (Gamma: 8.1, Zeta: 9.8, Alpha: 10.4, Delta: 8.9). The lowest CT values for both proteins and considering all variants occurred at 72 hpi (Gamma/N protein: 8.1, Delta/E protein: 11.1).
DiscussionThis study compares the replicative cycle and cytopathogenesis in Vero-E6 cells of the first four VOCs of SARS-CoV-2 isolated in Brazil. Vero cells, which are widely used in virus studies and in the production of human vaccines, have been shown to be a relevant model for studies of coronaviruses including SARS-CoV, SARS-CoV-2, and MERS-CoV.34-36 For this reason, we chose to use this cell line in our studies.
Several morphological alterations were observed in cells infected with SARS-CoV-2 VOCs, and the most common cellular changes occurred in mitochondria regardless of the kinetics time and the infection variant. One of the leading causes for this type of damage is reduced ATP production and, indeed, SARS-CoV-2 has been shown to induce this effect through activation of PARP-2 (poly [ADP-ribose]) polymerase 2, with subsequent NAD+ depletion.37 However, the virus can cause mitochondrial damage through different pathways and in several tissues.
Shang et al.38 observed that SARS-CoV-2 causes mitochondrial dysfunction through depolarization, mitochondrial permeability transition pore opening, and increased reactive oxygen species release. Furthermore, in response to these effects, there was increased expression and accumulation of Pink1 and Parkin proteins in mitochondria, in addition to Pink-1-mediated recruitment of P62 to mitochondria, which is suggestive of mitophagy for viral clearance.
Mitochondrial damage can lead to cell death and, on a large scale, cause functional impairment of the tissue. In the brain, for example, chronic hypoxia in severe SARS-CoV-2 infections can affect neuronal metabolism and damage mitochondria, causing long-term cognitive impairment.39 It has also been described that the virus can suppress mitochondrial function in cardiomyocytes by disrupting calcium cycling, leading to cell death.40 In the lung, the M protein of SARS-CoV-2 induces mitochondrial apoptosis of epithelial cells through the inactivation of B-Cell Lymphoma 2 (BCL-2) Ovarian Killer (BOK) ubiquitination and its translocation into the interior of the mitochondria. In addition, viral M protein also increases alveolar-capillary permeability, causing edema and compromising lung function.41
Decreased ATP production stops the Na+/K+ pumps, causing potassium and magnesium loss, plus water and calcium influx. Consequently, damage to various structures of the infected cell occurs, leading to cell death. The necrotic cell (or in the process of dying) presents ruptured internal membranes, which organize themselves in a spiral structure known as myelin figures41. This finding has previously been associated with SARS-CoV-2 infection.35,36
It is known that part of the replicative process of SARS-CoV-2 occurs in the replication complex formed by DMVs that results from the proliferation of the RER42. It is worth noting that the thickening of the RER in Vero-E6 cells infected with SARS-CoV-2 has already been reported in previous work performed by our group.35,36 Similarly, the formation of DMVs, reported in this study, is also well described within the replicative cycle of the virus.26 These are organelles whose formation is induced by the virus to isolate the viral genome from innate immunity mechanisms.43 In this study, we verified the thickening of the RER cisterns independently of the infection variant. They were presented incipiently in the first 24 h of infection and increased considerably in 48 h and 72 h; this same profile was also observed regarding the presence of DMVs. Our quantitative analyses demonstrated a higher number of viral particles in the cytosol and viral RNA in the supernatants at 48 and 72 hpi. These data may be related to the moment in which viral synthesis occurs more intensely.
Some studies have also pointed out interesting aspects of the interaction of SARS-CoV-2 with ribosomes. It is known, for example, that Nonstructural protein 1 (Nsp1) of the virus binds to ribosomes inhibiting mRNA entry,44 as well as inducing degradation of host Mrna.45 As a result, the synthesis of proteins in cell metabolism is disrupted. The control of the translation process is one of the strategies of the coronavirus for escaping the antiviral response.45 It is not yet clear whether this interaction is the reason for making ribosomes more electron-dense, but this feature often appears in ultrastructural analyses of Vero-E6 cells infected with SARS-CoV-2.36
In our studies, we observed the presence of lipid droplets in cells infected with the different variants at different kinetics times. The proliferation of lipid droplets as an effect of SARS-CoV-2 infection has been reported in vitro and in vivo studies36. Their localization in the cell coincides with that of viral particles. Moreover, drugs that inhibit lipid metabolism significantly alter SARS-CoV-2 replication, showing that these structures are essential for viral replication.46 Studies with dengue and hepatitis C viruses showed the interaction of viral proteins with lipid droplet-related components and the relationship of these organelles to positive-strand RNA virus replication.47
Previous in vitro studies by our group36 and Baselga et al.48 reported that the virus induces filopodium formation to maximize the infection process. It is also known that viral particles are highly concentrated in this region of filopodia, facilitating contact with the membrane of new cells. Our data corroborate this finding for all variants, with the Delta variant showing filopodium formation most intensely at the later time of infection (72 h).
Changes in nuclei, as well as syncytium formation, were rarely observed. Regarding nuclear changes, Oprinca et al.49 observed nuclear pyknosis in cardiomyocytes in four fatal cases of COVID-19. A placenta study showed that SARS-CoV-2 infection induces, in addition to other changes, karyorrhexis in the syncytiotrophoblast.50 The data from our research suggest the presence of these nuclear changes in infection by all variants, with the most significant difference compared to the control group in the first 24 hpi. However, data on this pattern of cellular damage in vitro models are still scarce.
Several studies in vitro and from human case death samples indicate that SARS-CoV-2 can induce syncytia formation.51,52 In assays performed using biological specimens from severe COVID-19 cases, syncytia in infected pneumocytes and nasal and bronchial epithelial cells were documented.53,54 Syncytium formation may contribute to SARS‐CoV‐2 replication and spread, immune evasion, and tissue damage. In vitro studies performed by Rajah et al. (2021) with Vero-E6, HEK293T, U2OS, Caco2/TC7, and Calu3 cell lines infected with different variants showed that this mechanism is considerable for the Alpha variant and almost nonexistent when infection occurs by Delta, and this pattern is corroborated by our research data.55
The quantitative analyses in this work showed the highest number of altered cells when monolayers were infected with the Delta variant, which showed the greatest statistically significant differences when compared to the control cells or the other variants. When infected with the Zeta variant, it led to the second highest number of alterations. Studies performed on a hamster model infected with the Zeta and D614G variants demonstrated more significant body weight loss, viral replication in the respiratory tract, and severe lung damage when infection occurred by the Zeta variant.56 Zeta greatly impacted Brazil. It significantly increased the number of hospitalizations and deaths for second time, which had been falling for more than 10-weeks. The number of deaths in Brazil was frequently above 4000 per day during the circulation of this variant.18 However, at a global level, circulation the of the Zeta variant was less relevant. Regarding the severity of infection, the literature shows that the Delta variant is the most prominent, with a 108 % to 120 % higher risk of hospitalization, 235 % to 287 % higher risk of admission to intensive care units, and 133 % to 137 % higher risk of mortality when compared to the Alpha variant data.57 These data, in addition to our results, suggest that there is a correlation between cell damage in vitro and the severity of cases of infection in humans.
Concerning the diameter of the viral particles, all SARS-CoV-2 variants had an average measure between 75 and 79 nm, corroborating the literature data from in vitro studies with SARS-CoV and SARS-CoV-2.54,58-60 Finally, the main limitation of this study is the need for more data in the literature to compare our results. Most studies focus on the most prevalent variant and usually compare it to the original strain or only one other variant, usually the latter being the more prevalent variant. Ultrastructural studies, especially within kinetics, are also rare. We hope that with this work, we can contribute to reducing this information gap and encourage and support future well-detailed research on this topic.
