There are scanty data on the epidemiology of influenza and other respiratory viruses in South America and Brazil. The aim of this study was to summarize the data from the Brazilian surveillance system of influenza and other respiratory viruses and discuss the patterns of viral circulation. The system is based on detecting cases of influenza-like illness in sentinel sites and weekly collection of five nasopharyngeal secretions samples, which are processed in state public health laboratories for respiratory viruses by indirect immunofluorescence assay. Data from 2000 to 2010 were described over time, by region, gender, and age group, and an analysis of Spearman correlation was performed between monthly influenza detection and rainfall and temperature data in two state capitals with the highest number of positive samples, one from the northeast region (Maceió) and other from the southern region (Curitiba). There were 3,291,946 visits for influenza-like illness; of these, 37,120 had samples collected and 6421 tested positive: 1690 (26%) influenza A, 567 (9%) influenza B, 277 (4%) parainfluenza 1, 571 (9%) parainfluenza 2, 589 (9%) parainfluenza 3, 742 (12%) adenovirus, and 1985 (31%) respiratory syncytial virus. Overall, increased activity of respiratory syncytial virus was observed from March to June, preceding the peak of influenza activity, from May to August, but with regional differences. In Maceió, there was a weak correlation between temperature and influenza detection (ρ=0.05), but a moderate positive correlation between rainfall and influenza detection (ρ=0.36). In Curitiba, a high correlation was observed between the decrease in temperature and rainfall and the increase in influenza detection (ρ=−0.83 and −0.78 respectively). These data are important to guide public health control measures as the best time for influenza vaccination and use of antivirals.
Acute respiratory infections of viral origin are among the leading causes of mortality and morbidity in young children, elderly, and immunocompromised patients in developed and developing countries.1 The influenza virus is the main respiratory virus that can lead to greater number of hospitalizations and deaths.2–7 In temperate countries, influenza activity has been well described, with marked seasons of influenza in the winter, usually December–April in the Northern Hemisphere and June–September in the Southern Hemisphere,8 whereas in tropical and subtropical regions of the world with ill-defined seasons, the circulation of influenza can be described as less pronounced seasonal fluctuations related to the rainy season or that occur throughout the year.9–11 In Brazil, the seasonality of influenza has been described as a wave that begins in April in northern equatorial and travels to the south for a period of approximately three months, reaching the temperate regions of the country in July.12 Data from the northeast region show that influenza season is linked to the rainy season in this region.13
Among other respiratory viruses, respiratory syncytial virus (RSV) is the leading cause of bronchiolitis in infants and is associated with substantial morbidity and mortality in children aged <5 years old14,15 and can also lead to hospitalizations and death in seniors and adults with chronic diseases.2,16 The RSV season typically overlaps the influenza season, beginning in the fall and lasting throughout the winter in temperate regions; and in tropical regions, it is associated with the rainy season.17 The parainfluenza virus (PIV) is the second leading cause of bronchiolitis and the leading cause of laryngotracheobronchitis or croup in children aged <5 years old.18,19 The PIV-1 and PIV-2 circulate more often during the fall, causing biennial epidemics in children, and PIV-1 is usually more prevalent. The PIV-3 circulates throughout the year with largest circulation in the second half of the year, during spring.20
The information on the epidemiology and seasonality of influenza and other respiratory viruses is crucial for the development of effective control measures, particularly the best time for application of influenza vaccine. However, information on the epidemiology of influenza and other respiratory viruses is sparse in middle- or low-income countries, located in tropical or subtropical regions of the world,10,11 especially in South America. Brazil is the largest country in South America, extending over 35° of latitude, which includes the Amazon tropical areas in the north to subtropical and temperate areas in the south. The Brazilian Ministry of Health began influenza and other respiratory viruses surveillance in 2000 with the following objectives: (a) monitor the strains of influenza viruses that circulate in the five Brazilian regions; (b) respond to unusual situations; (c) assess the impact vaccination against the disease; (d) follow the trend of morbidity and mortality associated with the disease; and (e) produce and disseminate epidemiological information.21
The aim of this study is to summarize the data generated by sentinel health units and state public health laboratories from 2000 to 2010 from the national sentinel surveillance system for influenza and other respiratory viruses and discuss the seasonality and circulation of respiratory viruses in Brazil.
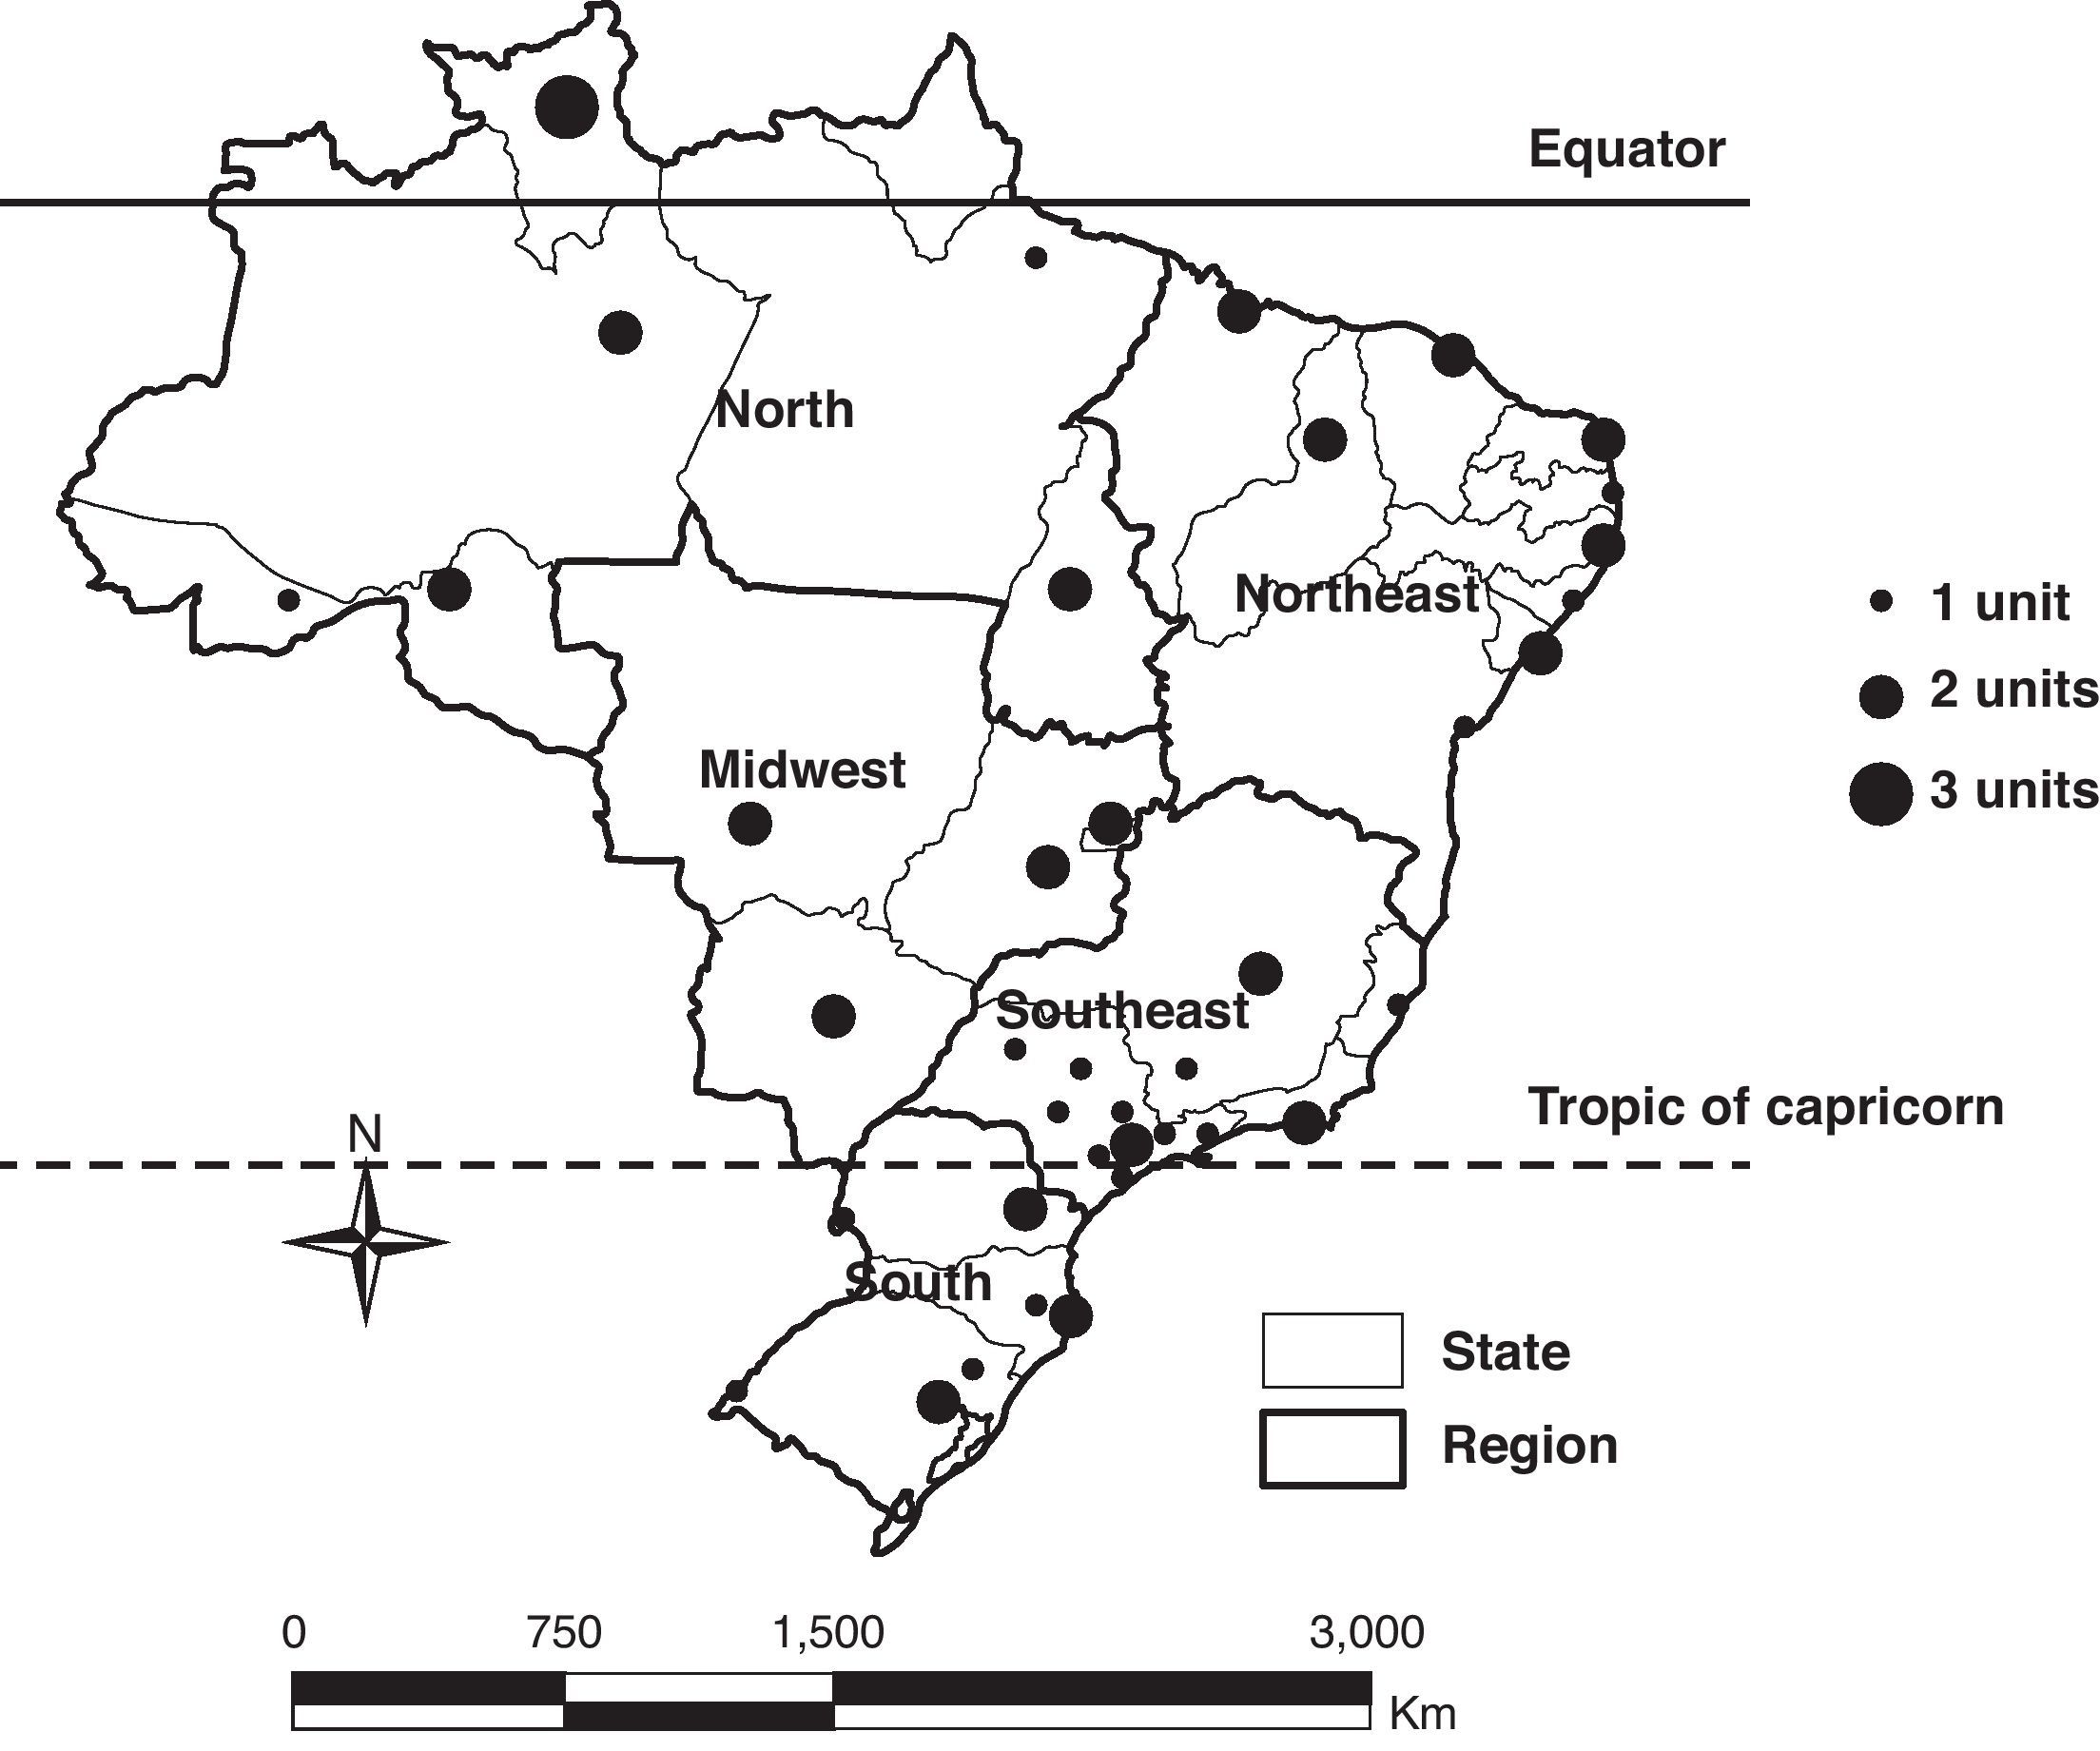
Materials and methodsThe sentinel surveillance of influenza and other respiratory viruses began with a sentinel unit in 2000 and expanded gradually to reach 60 units in 2010, reaching at least one unit in 26 of the 27 states, and all the five Brazilian regions (Fig. 1). This system is based on a network of sentinel units that include outpatient clinics, emergency care departments, or general hospitals that report weekly via an online system called SIVEP_Gripe, the aggregate total number of visits, and total visits for influenza-like illness (ILI), defined as a case of fever accompanied by cough or sore throat with no other diagnosis.

In addition, in these units, five samples of nasopharyngeal secretions should be collected weekly by swab or aspirate from patients with ILI. Samples are sent and tested in public health laboratories in each state by indirect immunofluorescence assay (IFA) for detection of influenza A and B, PIV 1, 2, and 3, adenovirus, and RSV. The results are reported weekly by the states’ public health laboratories through the SIVEP_Gripe. All positive, inconclusive, and 10% of the negative samples are forwarded to one of three national reference laboratories for respiratory viruses (Instituto Evandro Chagas in Belém, Instituto Adolfo Lutz in São Paulo and Fundação Oswaldo Cruz in Rio de Janeiro) where they are retested by polymerase chain reaction (PCR); positive samples for influenza are subtyped, sequenced, and forwarded to the collaborating center of World Health Organization (WHO) to make part of the Southern Hemisphere influenza vaccine.
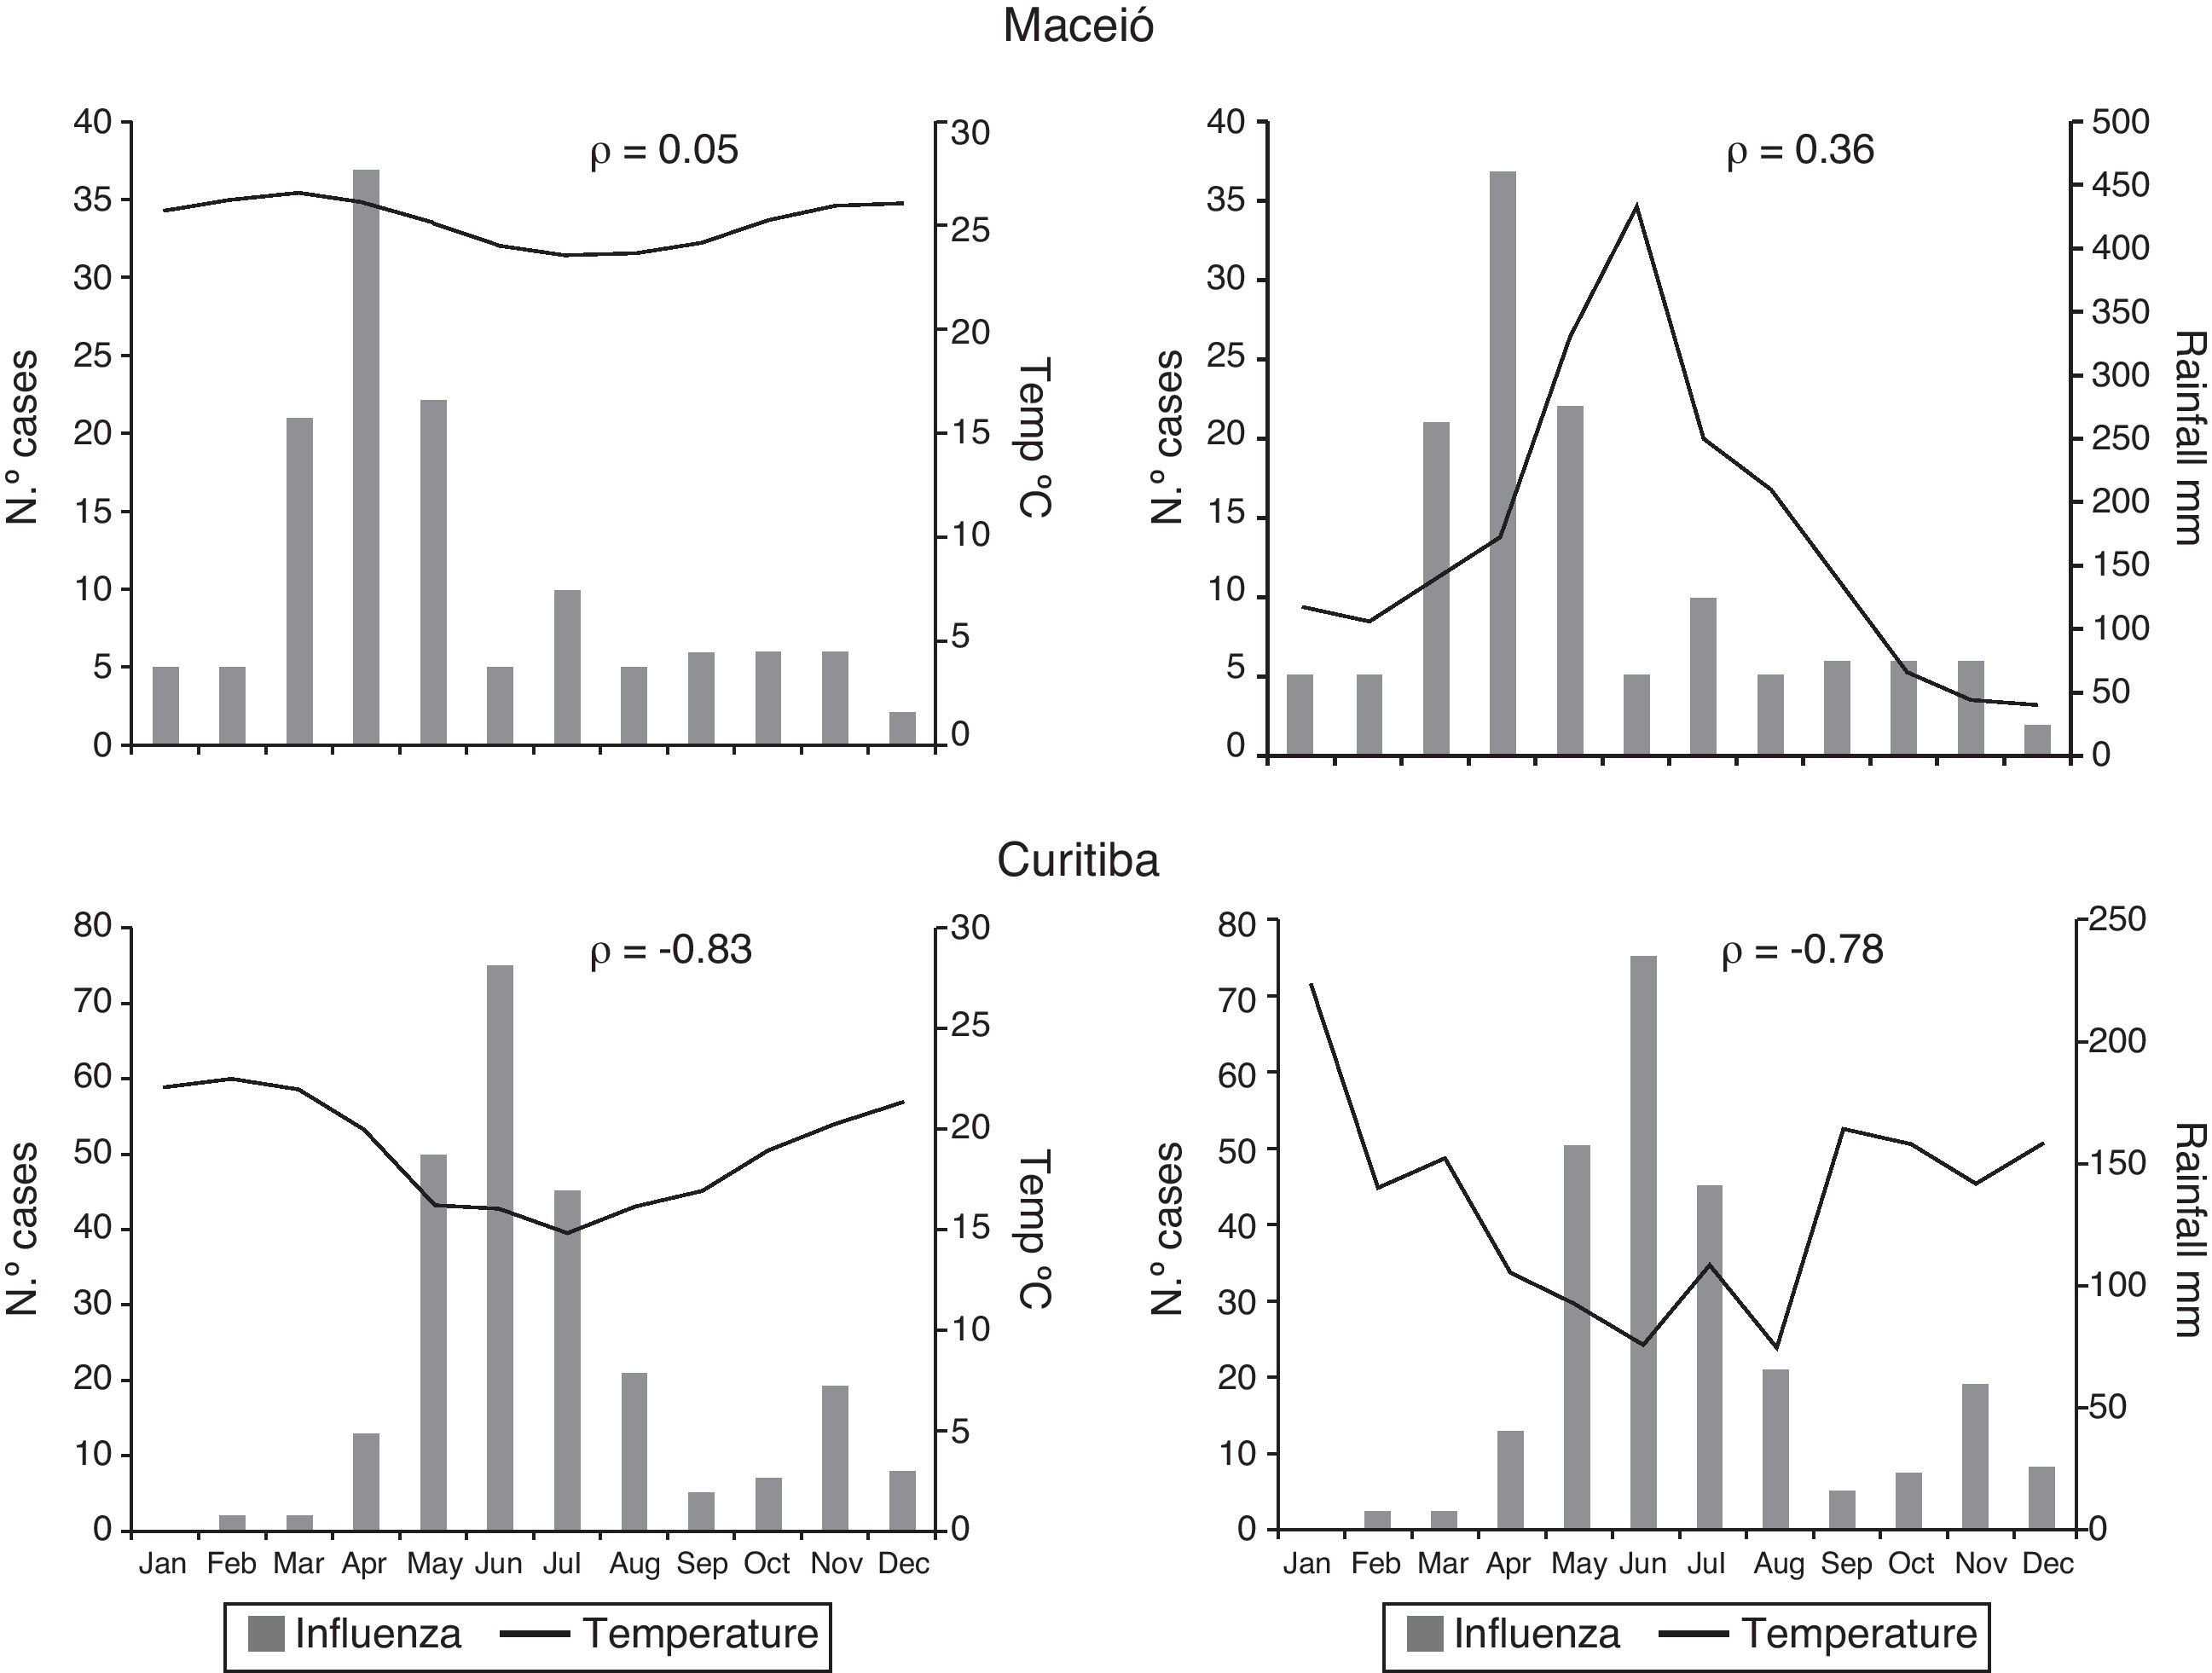
The data from the sentinel units and viral data from the states’ public health laboratories obtained by SIVEP_Gripe were analyzed descriptively, using PASW Statistics 18.0 software. The results of viruses’ identification were analyzed over time per month and year and stratified by gender, age group, and region. A correlation analysis was performed using the Spearman correlation coefficient between monthly influenza detection and average monthly temperature and rainfall using data from Maceió and Curitiba, the cities with the highest number of positive samples for influenza from the north and northeast regions and from the midwest, southeast, and south regions, respectively. Maceió is located at latitude 9.4°S and has a tropical climate. Curitiba is located at latitude 25.5°S and has a temperate climate. Meteorological data was obtained from the National Institute of Meteorology for the two cities studied from the period of study, 2000–2010.22
ResultsFrom 2000 to 2010, a total of 29,318,698 patients visits were recorded in the sentinel units and 3,291,946 visits were for ILI (11%). Of these patients, 37,120 (1% of total visits for ILI) had nasopharyngeal samples collected; 19,369 (52%) were female with a median age of 12 years old; 20,158 (54%) were children aged <15 years old.
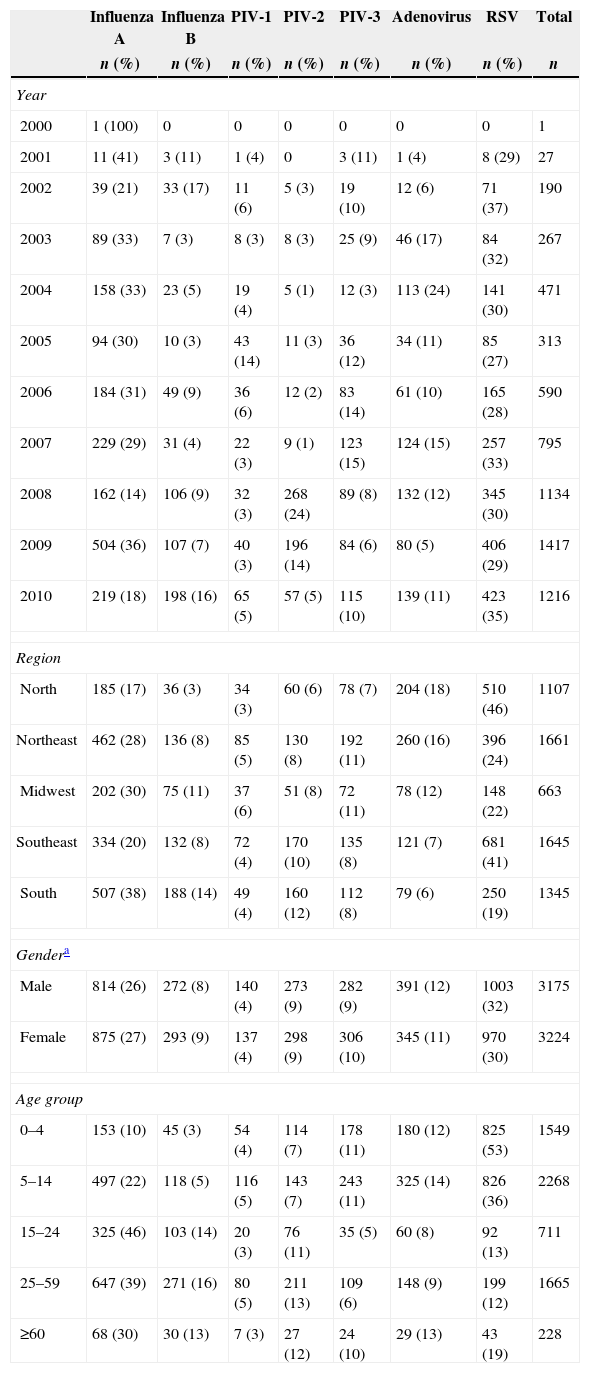
There were 6421 (17%) positive results; of these, 1690 (26%) were positive for influenza A, 567 (9%) for influenza B, 277 (4%) for PIV-1, 571 (9%) for PIV-2, 589 (9%) for PIV-3, 742 (12%) for adenovirus, and 1985 (31%) for RSV. The number of positive samples gradually increased, reaching more than 1000 positive samples in 2008. The northeast region was the region with the highest number of positive samples, 1661 (26%), and the midwest region with the lowest number, 663 (10%). The RSV virus was the main virus identified among children aged <15 years old, 1651 (43%), and the influenza virus was the main virus identified among persons aged ≥15 years old, 1040 (40%). The number and proportion respiratory viruses identified by year, region, gender, and age group are presented in Table 1.
Respiratory viruses identified in the sentinel units by year, region, gender and age. Brazil, 2000–2010.
| Influenza A | Influenza B | PIV-1 | PIV-2 | PIV-3 | Adenovirus | RSV | Total | |
|---|---|---|---|---|---|---|---|---|
| n (%) | n (%) | n (%) | n (%) | n (%) | n (%) | n (%) | n | |
| Year | ||||||||
| 2000 | 1 (100) | 0 | 0 | 0 | 0 | 0 | 0 | 1 |
| 2001 | 11 (41) | 3 (11) | 1 (4) | 0 | 3 (11) | 1 (4) | 8 (29) | 27 |
| 2002 | 39 (21) | 33 (17) | 11 (6) | 5 (3) | 19 (10) | 12 (6) | 71 (37) | 190 |
| 2003 | 89 (33) | 7 (3) | 8 (3) | 8 (3) | 25 (9) | 46 (17) | 84 (32) | 267 |
| 2004 | 158 (33) | 23 (5) | 19 (4) | 5 (1) | 12 (3) | 113 (24) | 141 (30) | 471 |
| 2005 | 94 (30) | 10 (3) | 43 (14) | 11 (3) | 36 (12) | 34 (11) | 85 (27) | 313 |
| 2006 | 184 (31) | 49 (9) | 36 (6) | 12 (2) | 83 (14) | 61 (10) | 165 (28) | 590 |
| 2007 | 229 (29) | 31 (4) | 22 (3) | 9 (1) | 123 (15) | 124 (15) | 257 (33) | 795 |
| 2008 | 162 (14) | 106 (9) | 32 (3) | 268 (24) | 89 (8) | 132 (12) | 345 (30) | 1134 |
| 2009 | 504 (36) | 107 (7) | 40 (3) | 196 (14) | 84 (6) | 80 (5) | 406 (29) | 1417 |
| 2010 | 219 (18) | 198 (16) | 65 (5) | 57 (5) | 115 (10) | 139 (11) | 423 (35) | 1216 |
| Region | ||||||||
| North | 185 (17) | 36 (3) | 34 (3) | 60 (6) | 78 (7) | 204 (18) | 510 (46) | 1107 |
| Northeast | 462 (28) | 136 (8) | 85 (5) | 130 (8) | 192 (11) | 260 (16) | 396 (24) | 1661 |
| Midwest | 202 (30) | 75 (11) | 37 (6) | 51 (8) | 72 (11) | 78 (12) | 148 (22) | 663 |
| Southeast | 334 (20) | 132 (8) | 72 (4) | 170 (10) | 135 (8) | 121 (7) | 681 (41) | 1645 |
| South | 507 (38) | 188 (14) | 49 (4) | 160 (12) | 112 (8) | 79 (6) | 250 (19) | 1345 |
| Gendera | ||||||||
| Male | 814 (26) | 272 (8) | 140 (4) | 273 (9) | 282 (9) | 391 (12) | 1003 (32) | 3175 |
| Female | 875 (27) | 293 (9) | 137 (4) | 298 (9) | 306 (10) | 345 (11) | 970 (30) | 3224 |
| Age group | ||||||||
| 0–4 | 153 (10) | 45 (3) | 54 (4) | 114 (7) | 178 (11) | 180 (12) | 825 (53) | 1549 |
| 5–14 | 497 (22) | 118 (5) | 116 (5) | 143 (7) | 243 (11) | 325 (14) | 826 (36) | 2268 |
| 15–24 | 325 (46) | 103 (14) | 20 (3) | 76 (11) | 35 (5) | 60 (8) | 92 (13) | 711 |
| 25–59 | 647 (39) | 271 (16) | 80 (5) | 211 (13) | 109 (6) | 148 (9) | 199 (12) | 1665 |
| ≥60 | 68 (30) | 30 (13) | 7 (3) | 27 (12) | 24 (10) | 29 (13) | 43 (19) | 228 |
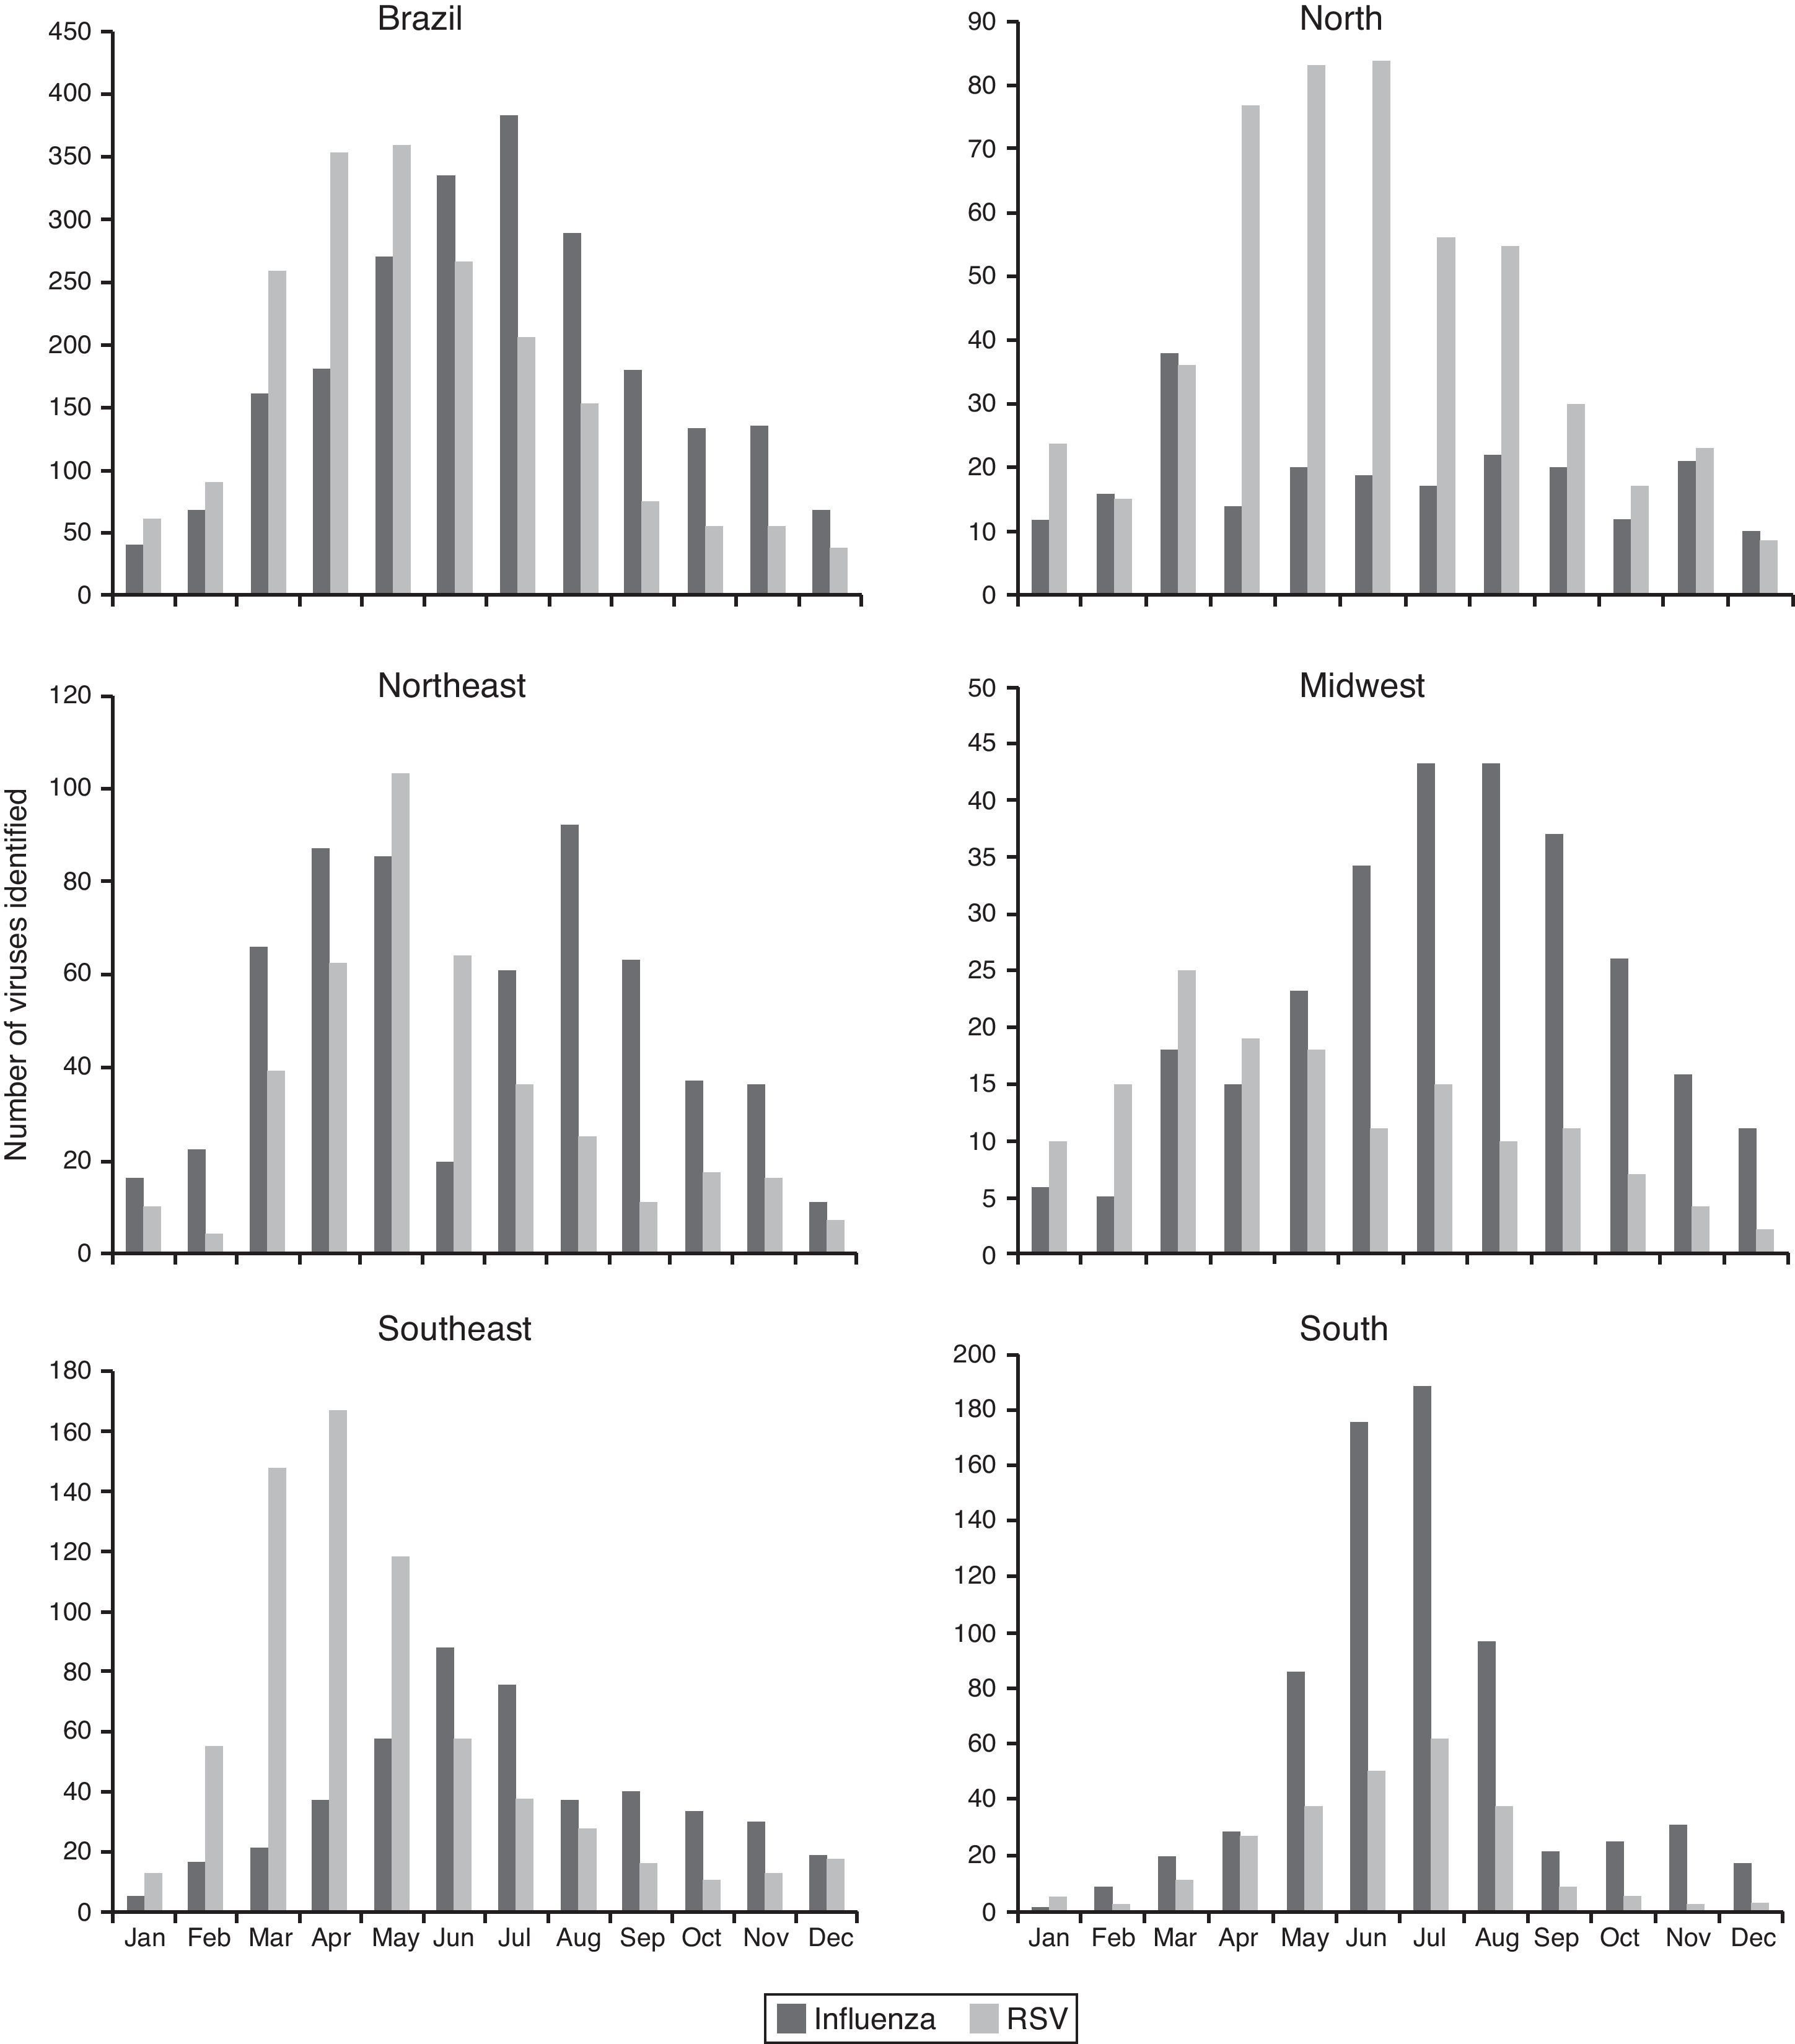
The influenza virus and RSV circulated throughout the year in Brazil and in all regions. The circulation of influenza and RSV overlapped in the country and in all regions, especially in the coolest months of the year, RSV activity was greater in autumn, from March to June, preceding the peak of influenza activity, more prominent in winter, from May to August (Fig. 2).
 identified in the sentinel units per month in Brazil and in its five regions, 2000–2010.")
In the north and northeast regions, the influenza virus circulated throughout the year without periods of clear predominance and RSV predominated from April to June. In the midwest, southeast, and south regions, circulation of influenza predominated from May to August, peaking in June and July in the southeast and south regions. There was a greater circulation of RSV from March to May in the midwest and southeast regions, while in the south region, a peak of RSV circulation coincided with a peak of influenza circulation, in June and July (Fig. 2).
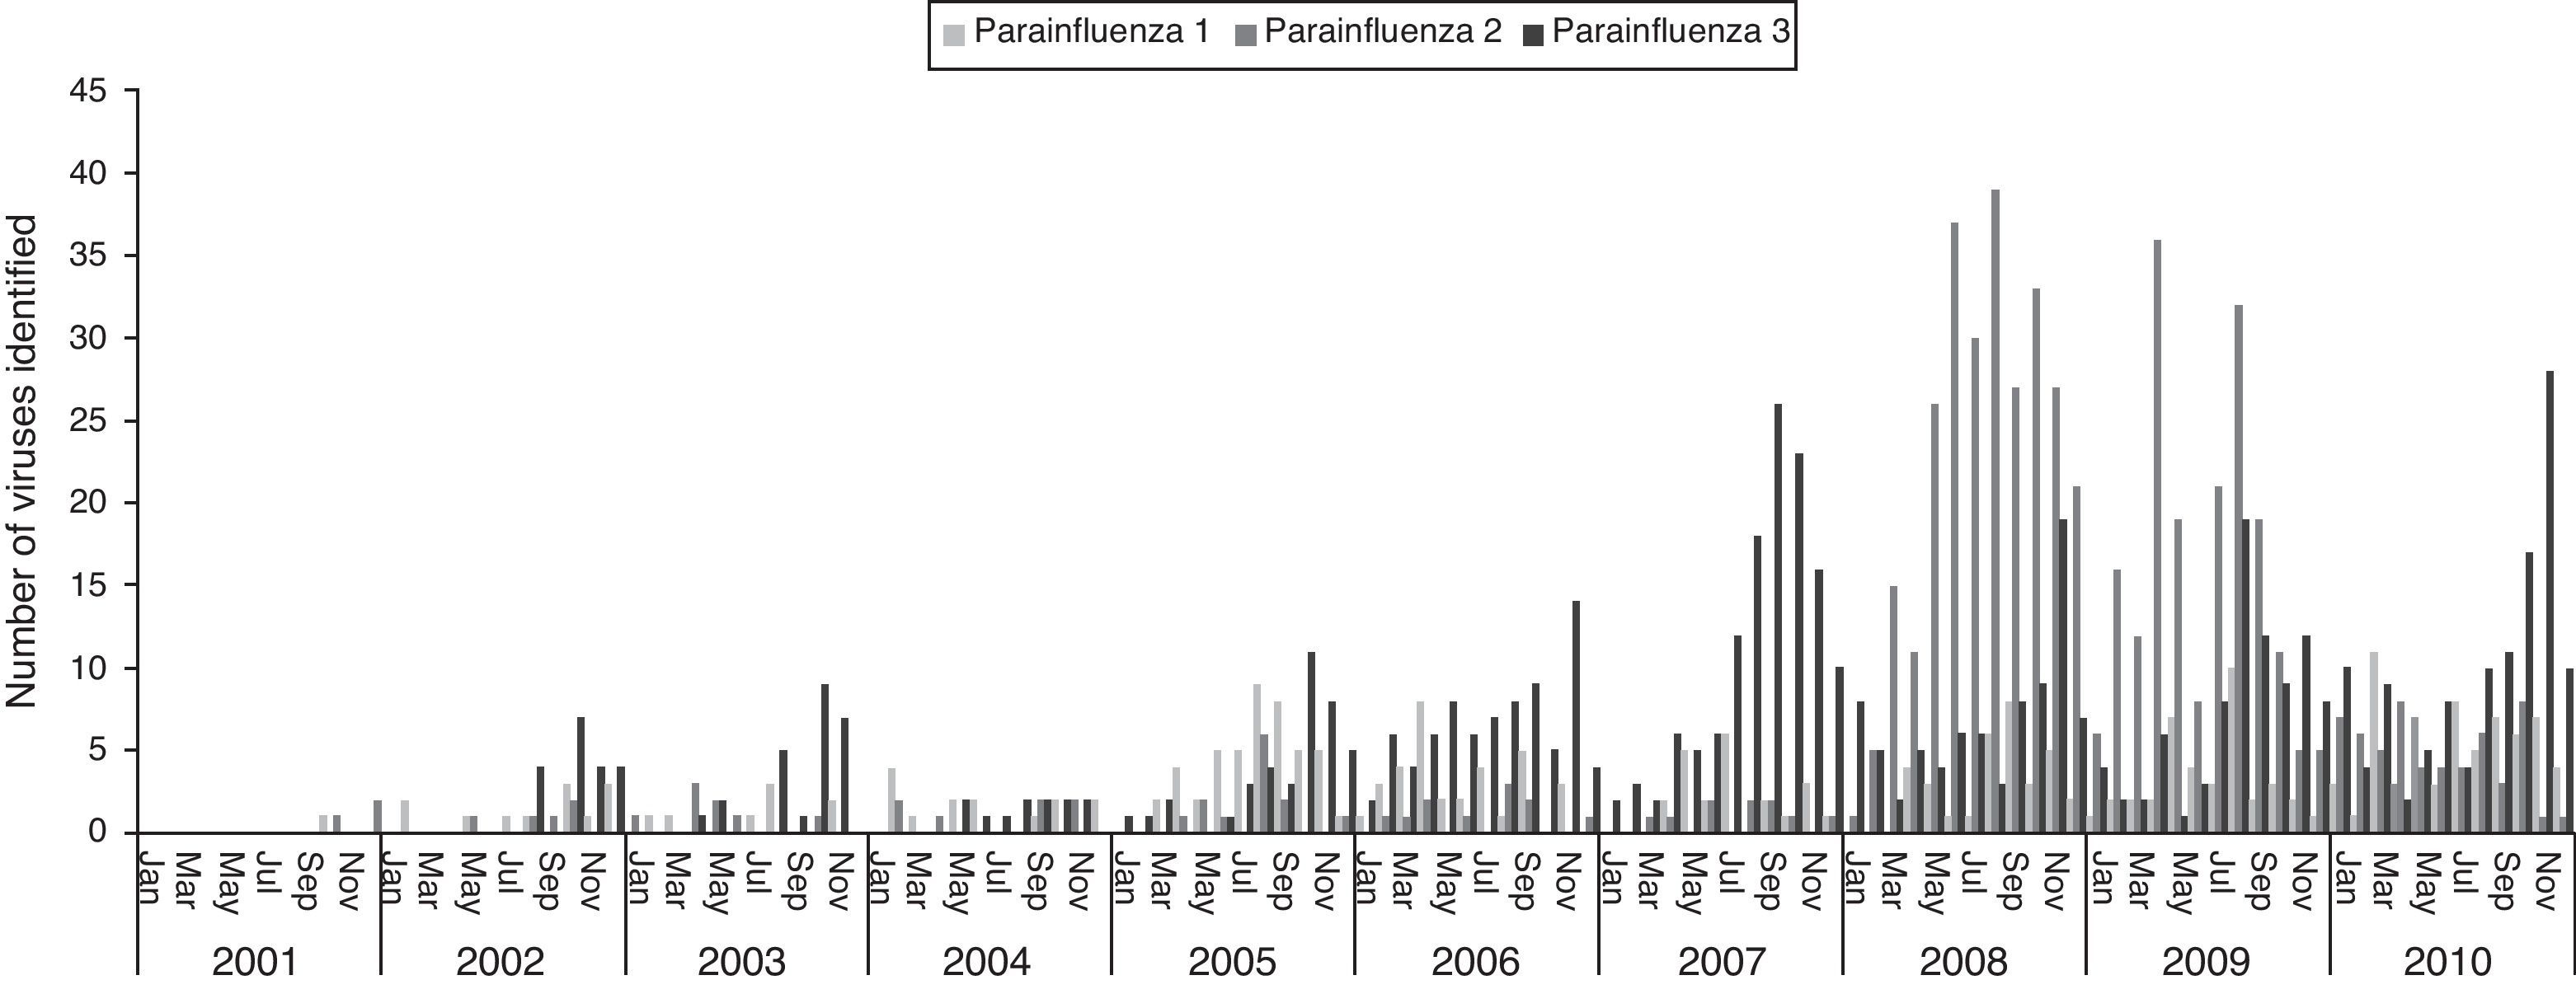
The three types of parainfluenza viruses co-circulated every year in Brazil, the PIV-3 the most frequent, with the highest circulation in the second half of the year, most evident from 2007. A major peak of PIV-2 was observed during 2008 and 2009 (Fig. 3).

From 2000 to 2010, Maceió presented little variation in average temperature during the year and a defined period of rain and drought. There was no significant correlation between monthly temperature and influenza detection (ρ=0.05); a moderate positive correlation was observed between monthly rainfall and influenza detection (ρ=0.36). Curitiba had a clear winter season with low temperatures and low rainfall. There was a high correlation between the decrease in temperature and rainfall and the increase in influenza detection (ρ=−0.83 and −0.78 respectively) (Fig. 4).
Discussion
Data from Brazilian sentinel surveillance of respiratory viruses from 2000 to 2010 show that the identification of influenza predominated among adults and RSV among children aged <15 years old. Both influenza and RSV circulated year-round, and the RSV season peaked in autumn, between March and June, preceding the peak of influenza season that occurred in the winter between May and August.
Nevertheless, there are regional differences. In the north and northeast regions there was no clear period of predominance in the circulation of influenza; a very weak correlation was observed between monthly temperature and influenza detection, but a moderate correlation between rainfall and influenza detection was seen in a state capital of northeastern Brazil. However, in the midwest, southeast, and south regions, there is a clearer seasonality, with higher detection of influenza among the months from June to August, correlated with low temperatures and low-rainfall period in a southern state capital of the country. The circulation of RSV has a similar seasonal pattern among the north, northeast, midwest and southeast regions, predominantly between the months of March and May, and only in the southern region, the RSV predominated during June and July, coinciding with the influenza season in this region.
Our data of viral circulation are in accordance with Brazilian studies reported by other authors who discuss the seasonality of influenza and RSV. In a study that used pneumonia and influenza mortality data from 1979 to 2001 to assess influenza seasonality in Brazil, it was observed that above latitude 15° S (which includes the entire northern region, much of the northeast region and part of the midwest region) there is no clear seasonality as it occurs below this point (including the south, southeast and much of the midwest regions). The circulation of influenza is described as a wave that starts in the equatorial regions in April and reaches the southern regions of the country of subtropical and temperate climate in July.12 A clear pattern of influenza seasonality in the north and northeast regions was not identified, unlike other regions, where one can observe a larger number of positive samples concentrated in the months of June and July. A prospective study of seven years based on viral data from Fortaleza, a capital of northeastern Brazil, located at latitude 4.3° S and with tropical climate, described the influenza season occurring in the first half of the year in the city, associated with the rainy season.13 A moderate correlation between monthly rainfall and detection of influenza cases was observed in Maceió, a state capital of northeastern Brazil with the same climate and located near Fortaleza. The main factors that determine the seasonality of influenza is still an open question, especially in tropical areas of the world. Probably the combined action of environmental factors (humidity, temperature, and solar radiation), factors related to immunity in the population and demographic factors (population density, population flows, school calendar, and travel or migration) interferes with viral circulation in different parts of the world.23 Human agglomeration during the rainy season on the northern tropical Brazil and during the winter in subtropical and temperate southern Brazil may drive the differences in influenza seasonality seen in different regions of the country.
Unlike influenza, surveillance data show that the circulation of RSV is very similar in the north and northeast regions to the midwest and southeastern Brazil, occurring mostly in the fall. Only in the southern region, the RSV circulation prevails in the winter along with the circulation of influenza. Studies with viral data held in southeastern Brazil in the cities of Rio de Janeiro,24 Vitória,25 São Paulo,26,27 Campinas,28 and Uberlândia29,30 showed an RSV season from February to August, peaking in May. The study of an outbreak of RSV in Salvador, northeastern Brazil, also showed a pattern of viral circulation similar to that observed in the southeast, beginning in the fall and lasting until the end of winter.31 Studies in Fortaleza associated the circulation of RSV in the first half of the year with the rainy season.32,33 Studies in the southern region corroborate surveillance data for RSV; they showed a predominance of the RSV identification in the winter, between July and October in the cities of Porto Alegre34 and Pelotas.35
Among the parainfluenza viruses, the type 3 was the most common, with the highest circulation in the second half of the year in early spring, a pattern similar to that observed in studies conducted in Rio de Janeiro24 and Fortaleza.20 We observed an outbreak of PIV-2 in 2008–2009 in Brazil; in the United States this virus has been associated with epidemics every two years, co-circulating with PIV-1 during the fall.36,37
This study has limitations: it is eleven years of a surveillance system that has gradually expanded, the number of positive samples is still small, and more recent years are likely to be over-represented. More years with a larger number of samples are still necessary to verify the observed patterns of seasonality. Furthermore, sentinel data cannot be truly representative for the whole population and the system of sentinel units involves different levels of complexity of care; there is no standard protocol for patient selection for sample collection which can lead to a selection bias. The largest number of samples from children suggests a selection bias for this group, which probably resulted in a greater number of positive samples for RSV. The technique used for processing the samples was IFA, which has a sensitivity of 60–70% when compared with molecular biology techniques such as PCR,38 which may have underestimated the number of detected cases because of false-negative results.
Despite these limitations, the surveillance system for influenza and other respiratory viruses has proved useful to describe the patterns of viral circulation in the country. This information is important for deciding the best time for influenza vaccination and treatment decisions for the use of influenza antivirals according to disease seasonality, besides contributing with Brazilian samples for the formulation of Southern Hemisphere's influenza vaccine. Although the implementation and development of a sentinel surveillance system for influenza and other respiratory viruses is the first step to understand the epidemiology of these viruses in the country, more investments in influenza and other respiratory viruses surveillance are needed to obtain epidemiological data that can estimate and quantify the impact of influenza and other respiratory viruses to public health, besides improving the system's representativeness, timeliness, and capacity to intervene.
Conflict of interestAll authors declare to have no conflict of interest.
The author thanks the influenza surveillance team from the Brazilian Ministry of Health: José Ricardo Pio Marins, Marcia Lopes de Carvalho, Fabiano Marques Rosa, Walquiria Aparecida Ferreira de Almeida, Libia Roberta de Oliveira Souza, and Daiana Araujo da Silva for their help and all professionals from Brazilian states and municipalities involved with influenza surveillance who have worked on the formation and maintenance of influenza and other respiratory viruses surveillance in Brazil.
