Men who have sex with men are at risk of tenofovir nephrotoxicity due to its wide use in both treatment and prophylaxis for human immunodeficiency virus infection, but little is known about the urinary biomarkers of early renal dysfunction in this population. This study aims to identify useful biomarkers of early renal dysfunction among human immunodeficiency virus-infected men who have sex with men exposed to tenofovir.
MethodsIn a cross-sectional study urinary alpha1-microglobulin, beta2-microglobulin, N-acetyl-β-d-glucosaminidase and albumin were measured and expressed as the ratio-to-creatinine in 239 human immunodeficiency virus-infected men who have sex with men who were treatment naïve or receiving antiretroviral therapy with tenofovir-containing or non-tenofovir-containing regimens. Additionally, 56 patients in the non-antiretroviral therapy group started a tenofovir-containing regimen and were assessed after 3 and 6 months on antiretroviral therapy.
ResultsBoth the frequency of alpha1-microglobulin proteinuria (alpha1-microglobulin-creatinine ratio >25.8mg/g) and the median urinary alpha1-microglobulin-creatinine ratio were higher in the tenofovir disoproxil fumarate group than the other two groups (all p<0.05). A higher frequency of beta2-microglobulin proteinuria (beta2-microglobulin-creatinine ratio >0.68mg/g) was also observed in the tenofovir group (28.9%) compared to the non-tenofovir group (13.6%, p=0.024). There were no significant differences between groups for N-acetyl-β-d-glucosaminidase and albumin. In the longitudinal study, the median urinary alpha1-microglobulin-creatinine ratio after 3 and 6 months on tenofovir-containing therapy (16.8 and 17.3mg/g) was higher than baseline (12.3mg/g, p=0.023 and 0.011, respectively), while no statistically important changes were observed in urinary beta2-microglobulin-creatinine ratio or in the other biomarkers after 3 and 6 months on antiretroviral therapy (all p>0.05).
ConclusionUrinary alpha1-microglobulin seems to be a more sensitive and stable indicator of tubular dysfunction than urinary beta2-microglobulin for assessing tenofovir-related nephrotoxicity and can be significantly altered after tenofovir exposure.
The prevalence of HIV-associated kidney disease has decreased in the era of antiretroviral therapy (ART), but drug-induced nephrotoxicity is emerging.1 Long-term exposure to nephrotoxic antiretroviral drugs, such as tenofovir disoproxil fumarate (TDF), may lead to progression of renal dysfunction and incomplete reversibility of toxicity, even after drug withdrawal.2,3 Moreover, some urinary biomarkers of early kidney injury were found to be associated with important clinical outcomes, such as mortality and severe heart disease.4,5 Therefore, it is important to detect early renal dysfunction in HIV-infected individuals, particularly in those exposed to TDF.
TDF is widely used as a preferential drug for ART according to worldwide guidelines, and it is also part of the only approved regimen for pre-exposure prophylaxis to HIV infection.6 The drug is excreted through glomerular filtration and proximal tubular secretion, and its use has been related to an increased risk of rapid decline in renal function and chronic kidney disease.2 Clinically, renal insufficiency is usually assessed by an estimated glomerular filtration rate (eGFR),7 but proximal tubular dysfunction is more common and specific for TDF-induced toxicity8 and can occur with the absence of glomerular defects.9
The evaluation of urinary biomarkers, such as α1-microglobulin (α1M), β2-microglobulin (β2M) and N-acetyl-β-d-glucosaminidase (NAG), may improve the identification of those at risk of tubular toxicity and may detect early stages of renal dysfunction.10,11 However, the evaluation criteria of these proteins in tubular dysfunction have not been established and little is known about the change of these new biomarkers during ART. The role of the aforementioned biomarkers in diagnosing and monitoring early tubular damage still needs to be explored.
HIV transmission is increasing markedly faster among MSM than other high-risk groups in China and some other countries.12,13 MSM are at risk of TDF toxicity due to its comprehensive role in treatment and pre-exposure prophylaxis. However, most biomarkers of early renal dysfunction have not been validated in HIV-infected patients let alone in specific key-populations, such as MSM. Our study aims to investigate the presence of early renal dysfunction among HIV-infected MSM and to find the indicators of early renal injury in MSM with TDF exposure.
Materials and methodsStudy populationWe performed a cross-sectional study and a longitudinal study with a single-center cohort of HIV-infected MSM at the First Hospital of China Medical University in Shenyang, a major city in northern China that has a rapidly increasing incidence of HIV infection among MSM.14 A total of 239 MSM receiving care at the AIDS clinic were enrolled in a cross-sectional study between August 2012 and June 2014. All participants in the study were adults (age ≥18 years) who were treatment-naïve or had received the current ART regimen for no less than six months. The patients who had used other non-ART nephrotoxic drugs in the previous two months before enrollment were excluded from the study.
The ART regimens were based on either Efavirenz (EFV) or Lopinavir/ritonavir (LPV/r). The other two ART drugs were lamivudine (3TC) plus TDF (TDF group) and 3TC plus zidovudine (AZT) (non-TDF group). Fifty-six patients in the non-ART group who started TDF/3TC/EFV were enrolled in a longitudinal study and were assessed after 3 and 6 months on ART. This study was approved by the Medical Research Ethics Committee of the First Hospital of China Medical University. Written informed consent for participation in this study was obtained from each participant.
Data collectionDemographic characteristics; medical history, such as diabetes, hypertension, and prior AIDS-defining illness; and other clinical and laboratory data of each subject were obtained from the clinical records and laboratory database. Body weight was also measured. Fasting blood and mid-stream urine specimens were collected at the routine morning consultation. Blood samples were assayed for full blood count, CD4T cell count, HIV RNA level, β2M, and routine biochemistry levels, including renal, liver, glucose, calcium, phosphorus, and lipid profiles.
Spot urine samples were tested for α1M, β2M, NAG, creatinine, and albumin within four hours after sample collection in the clinical laboratory of our hospital. The urinary levels of α1M, β2M and albumin were determined by a Siemens BN II nephelometer Analyzer II with the kits from Siemens. NAG was measured with a 6-methyl-2-pyridinethiol (MPT) assay (Leadman Biotechnologies Inc., Beijing), and urinary creatinine was measured by enzymatic methods using an automated multianalyzer (HITACHI 7600, Tokyo, Japan). The upper reference limits given by the manufacturer were 0.3mg/L for urinary β2M, 12mg/L for urinary α1M, and 11.5IU/L for NAG. All of the urinary proteins were expressed as the ratio-to-creatinine (α1MCR, β2MCR, NAGCR, and ACR) to account for the variations in urine concentration among individuals.
DefinitionHypertension was self-reported or diagnosed as a systolic BP ≥140, diastolic BP ≥90mmHg, or current treatment of hypertension with antihypertensive drugs. Diabetes was defined as a fasting blood glucose ≥7.0mmol/L or a self-reported history of diabetes. Hypocalcemia and hypophosphatemia were defined based on the reference ranges in the local clinical laboratory as serum calcemia <2.17mmol/L and serum phosphate <0.81mmol/L. The eGFR was calculated using the Chronic Kidney Disease Epidemiology Collaboration (CKDEPI).15 Albuminuria was defined as an ACR >30mg/g.16 Because there are no accepted criteria for the proteinuria of α1M, β2M and NAG, we used the upper quartile (UQ) values of α1MCR, β2MCR and NAGCR of all participants to define abnormality.
Statistical analysisAll analyses were performed using SPSS software, version 18.0 (SPSS, Inc., Chicago, IL, USA). Data are presented as means±standard deviation (mean±SD), medians with inter-quartile ranges (IQR) for continuous variables, and as proportions for categorical variables. Appropriate variables were compared by one-way ANOVA and independent-sample t tests for continuous variables; χ2 test or Fisher exact test for categorical variables. We calculated Spearman rank correlation coefficients to determine the relationship between urinary proteins and serum β2M. Risk factors of UQ β2MCR and UQ α1MCR were identified with multivariate logistic regression analysis. We considered a p-value <0.05 to be statistically significant.
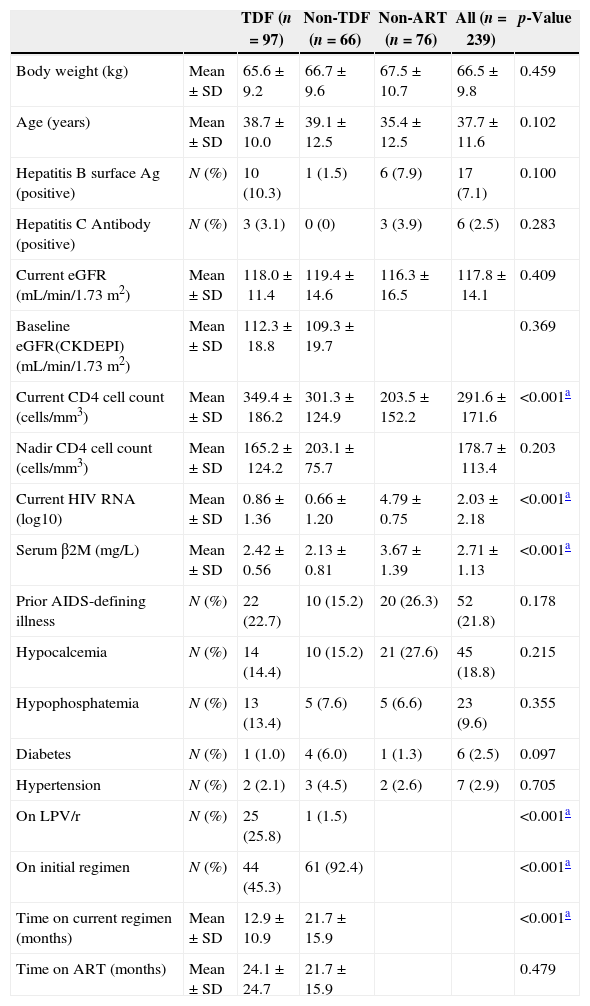
ResultsTwo-hundred-thirty-nine HIV-infected MSM were enrolled in the study and stratified by ART into the three groups: TDF group (n=97), non-TDF group (n=66), and non-ART group (n=76). The characteristics of the participants are given in Table 1. In the study sample, the frequency of hypertension, diabetes and hypophosphatemia were 2.9% (n=7), 2.5% (n=6), and 9.6% (n=23), respectively. Although almost half of the patients in the TDF group were treatment experienced with a non-TDF-containing regimen, the total ART time in both ART groups was similar (p>0.05).
Demographic and clinical characteristics of the HIV-infected MSM.
| TDF (n=97) | Non-TDF (n=66) | Non-ART (n=76) | All (n=239) | p-Value | ||
|---|---|---|---|---|---|---|
| Body weight (kg) | Mean±SD | 65.6±9.2 | 66.7±9.6 | 67.5±10.7 | 66.5±9.8 | 0.459 |
| Age (years) | Mean±SD | 38.7±10.0 | 39.1±12.5 | 35.4±12.5 | 37.7±11.6 | 0.102 |
| Hepatitis B surface Ag (positive) | N (%) | 10 (10.3) | 1 (1.5) | 6 (7.9) | 17 (7.1) | 0.100 |
| Hepatitis C Antibody (positive) | N (%) | 3 (3.1) | 0 (0) | 3 (3.9) | 6 (2.5) | 0.283 |
| Current eGFR (mL/min/1.73m2) | Mean±SD | 118.0±11.4 | 119.4±14.6 | 116.3±16.5 | 117.8±14.1 | 0.409 |
| Baseline eGFR(CKDEPI)(mL/min/1.73m2) | Mean±SD | 112.3±18.8 | 109.3±19.7 | 0.369 | ||
| Current CD4 cell count (cells/mm3) | Mean±SD | 349.4±186.2 | 301.3±124.9 | 203.5±152.2 | 291.6±171.6 | <0.001a |
| Nadir CD4 cell count (cells/mm3) | Mean±SD | 165.2±124.2 | 203.1±75.7 | 178.7±113.4 | 0.203 | |
| Current HIV RNA (log10) | Mean±SD | 0.86±1.36 | 0.66±1.20 | 4.79±0.75 | 2.03±2.18 | <0.001a |
| Serum β2M (mg/L) | Mean±SD | 2.42±0.56 | 2.13±0.81 | 3.67±1.39 | 2.71±1.13 | <0.001a |
| Prior AIDS-defining illness | N (%) | 22 (22.7) | 10 (15.2) | 20 (26.3) | 52 (21.8) | 0.178 |
| Hypocalcemia | N (%) | 14 (14.4) | 10 (15.2) | 21 (27.6) | 45 (18.8) | 0.215 |
| Hypophosphatemia | N (%) | 13 (13.4) | 5 (7.6) | 5 (6.6) | 23 (9.6) | 0.355 |
| Diabetes | N (%) | 1 (1.0) | 4 (6.0) | 1 (1.3) | 6 (2.5) | 0.097 |
| Hypertension | N (%) | 2 (2.1) | 3 (4.5) | 2 (2.6) | 7 (2.9) | 0.705 |
| On LPV/r | N (%) | 25 (25.8) | 1 (1.5) | <0.001a | ||
| On initial regimen | N (%) | 44 (45.3) | 61 (92.4) | <0.001a | ||
| Time on current regimen (months) | Mean±SD | 12.9±10.9 | 21.7±15.9 | <0.001a | ||
| Time on ART (months) | Mean±SD | 24.1±24.7 | 21.7±15.9 | 0.479 |
p-Value for comparison between the three groups.
TDF, tenofovir disoproxil fumarate; ART, antiretroviral therapy; eGFR, estimated glomerular filtration rate; β2M, beta2-microglobulin; AIDS, acquired immune deficiency syndrome; LPV/r, lopinavir/ritonavir.
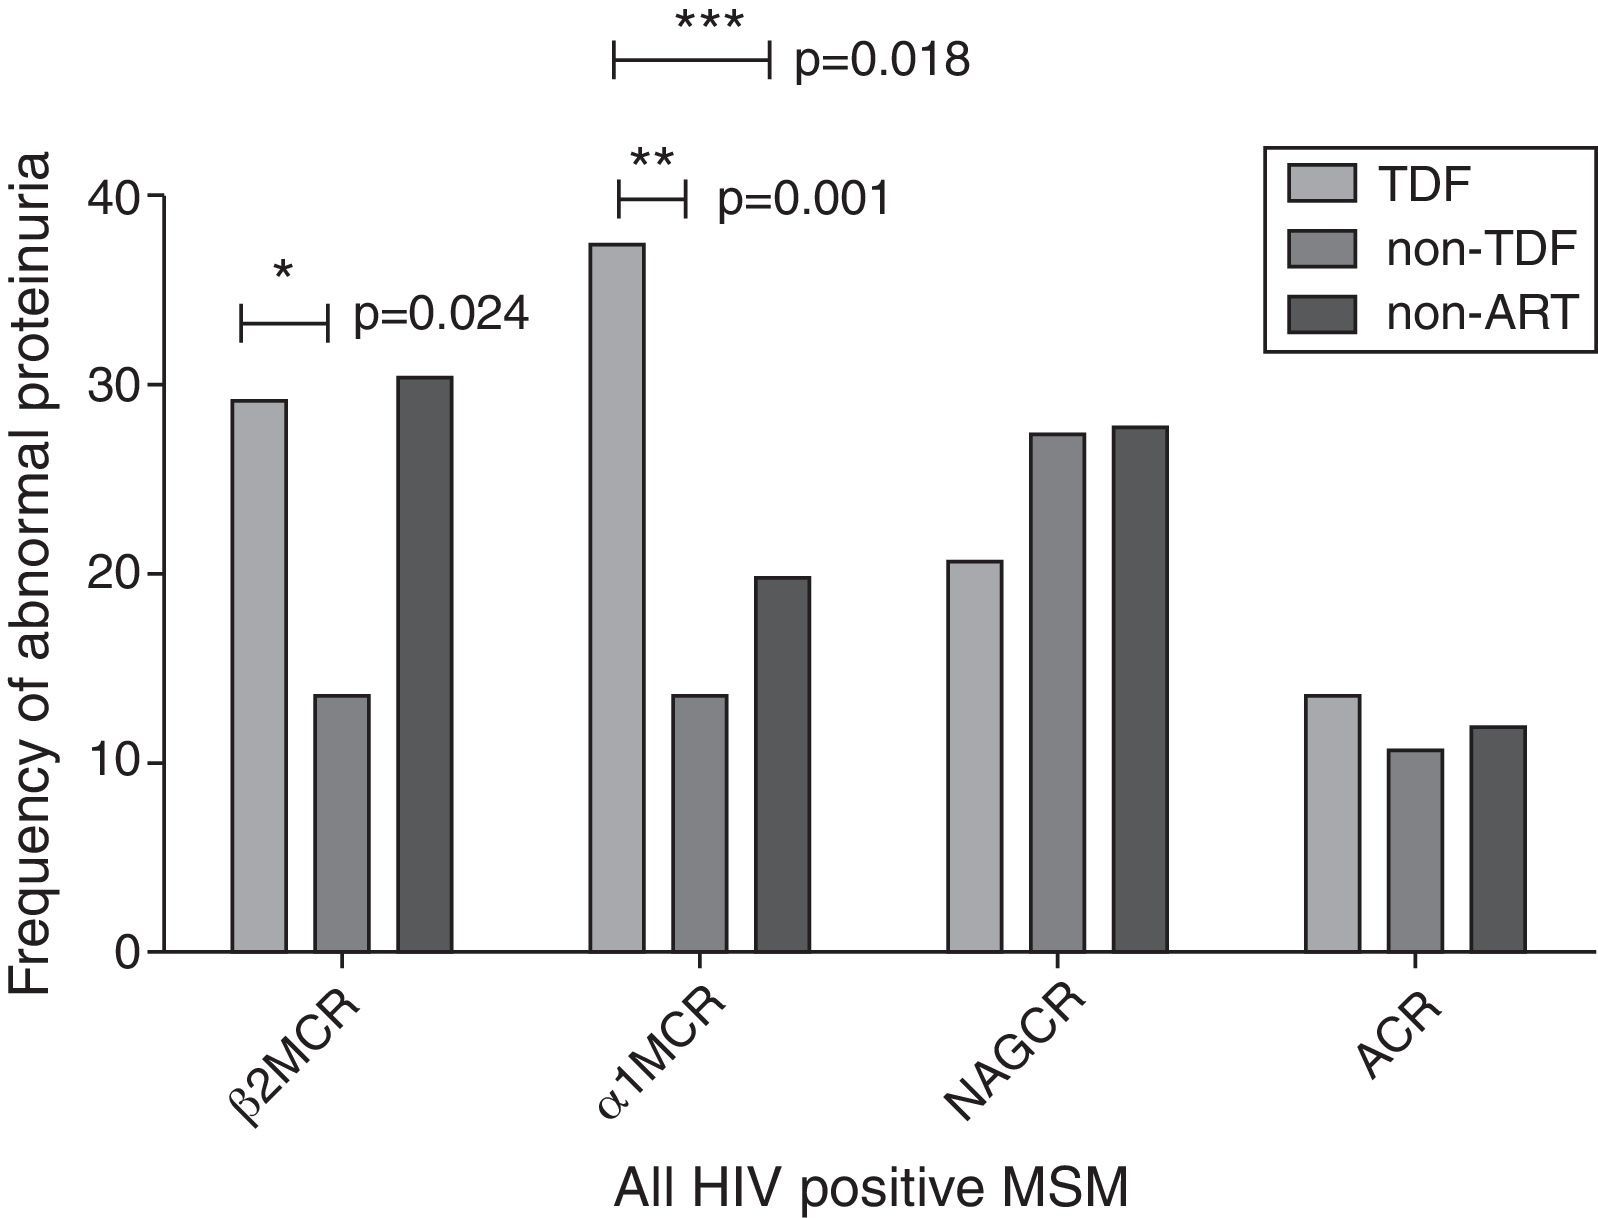
In the cross-sectional study, an eGFR<90mL/min/1.73m2 was seen in eight patients (3.3%) and an eGFR<60mL/min/1.73m2 was seen in only two patients (0.8%). Albuminuria was present in 12.1% of our participants. As shown in Fig. 1 and Table 2, the TDF group had a higher frequency of α1M proteinuria (α1MCR >25.8mg/g) and a higher α1MCR value than the other two groups (all p<0.05). A higher frequency of β2M proteinuria (β2MCR >0.68mg/g) was also observed in the TDF group compared to the non-TDF group (p=0.024). No significant differences were found in β2MCR among the three groups. Statistical analysis revealed no significant differences in abnormal frequency or ratio-to-creatinine value of urinary NAG and albumin among the three groups.

Proportion of tubular and glomerular proteinuria among the study groups.
Albuminuria was defined as ACR >30mg/g. Other kinds of proteinuria were defined as β2MCR >0.68mg/g, α1MCR >25.8mg/g, and NAGCR >9.1IU/g, respectively. ACR, urinary albumin-to-creatinine ratio; β2MCR, beta2-microglobulin-to-creatinine ratio; α1MCR, alpha1-microglobulin-to-creatinine ratio; NAGCR, N-acetyl-β-d-glucosaminidase-to-creatinine ratio.
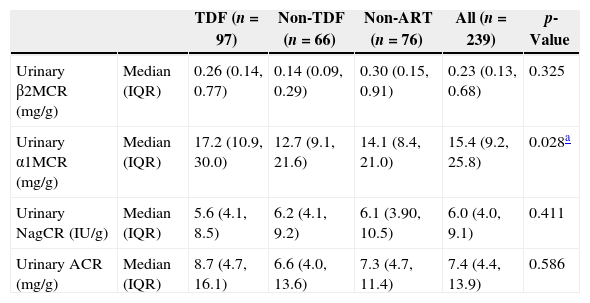
The levels of urinary proteins in the subjects.
| TDF (n=97) | Non-TDF (n=66) | Non-ART (n=76) | All (n=239) | p-Value | ||
|---|---|---|---|---|---|---|
| Urinary β2MCR (mg/g) | Median (IQR) | 0.26 (0.14, 0.77) | 0.14 (0.09, 0.29) | 0.30 (0.15, 0.91) | 0.23 (0.13, 0.68) | 0.325 |
| Urinary α1MCR (mg/g) | Median (IQR) | 17.2 (10.9, 30.0) | 12.7 (9.1, 21.6) | 14.1 (8.4, 21.0) | 15.4 (9.2, 25.8) | 0.028a |
| Urinary NagCR (IU/g) | Median (IQR) | 5.6 (4.1, 8.5) | 6.2 (4.1, 9.2) | 6.1 (3.90, 10.5) | 6.0 (4.0, 9.1) | 0.411 |
| Urinary ACR (mg/g) | Median (IQR) | 8.7 (4.7, 16.1) | 6.6 (4.0, 13.6) | 7.3 (4.7, 11.4) | 7.4 (4.4, 13.9) | 0.586 |
p-Value for comparison between the three groups.
β2MCR, beta2-microglobulin-creatinine ratio; α1MCR, alpha1-microglobulin-creatinine ratio; NAGCR, N-acetyl-β-D-glucosaminidase-creatinine ratio; ACR, albumin-creatinine ratio (urine).
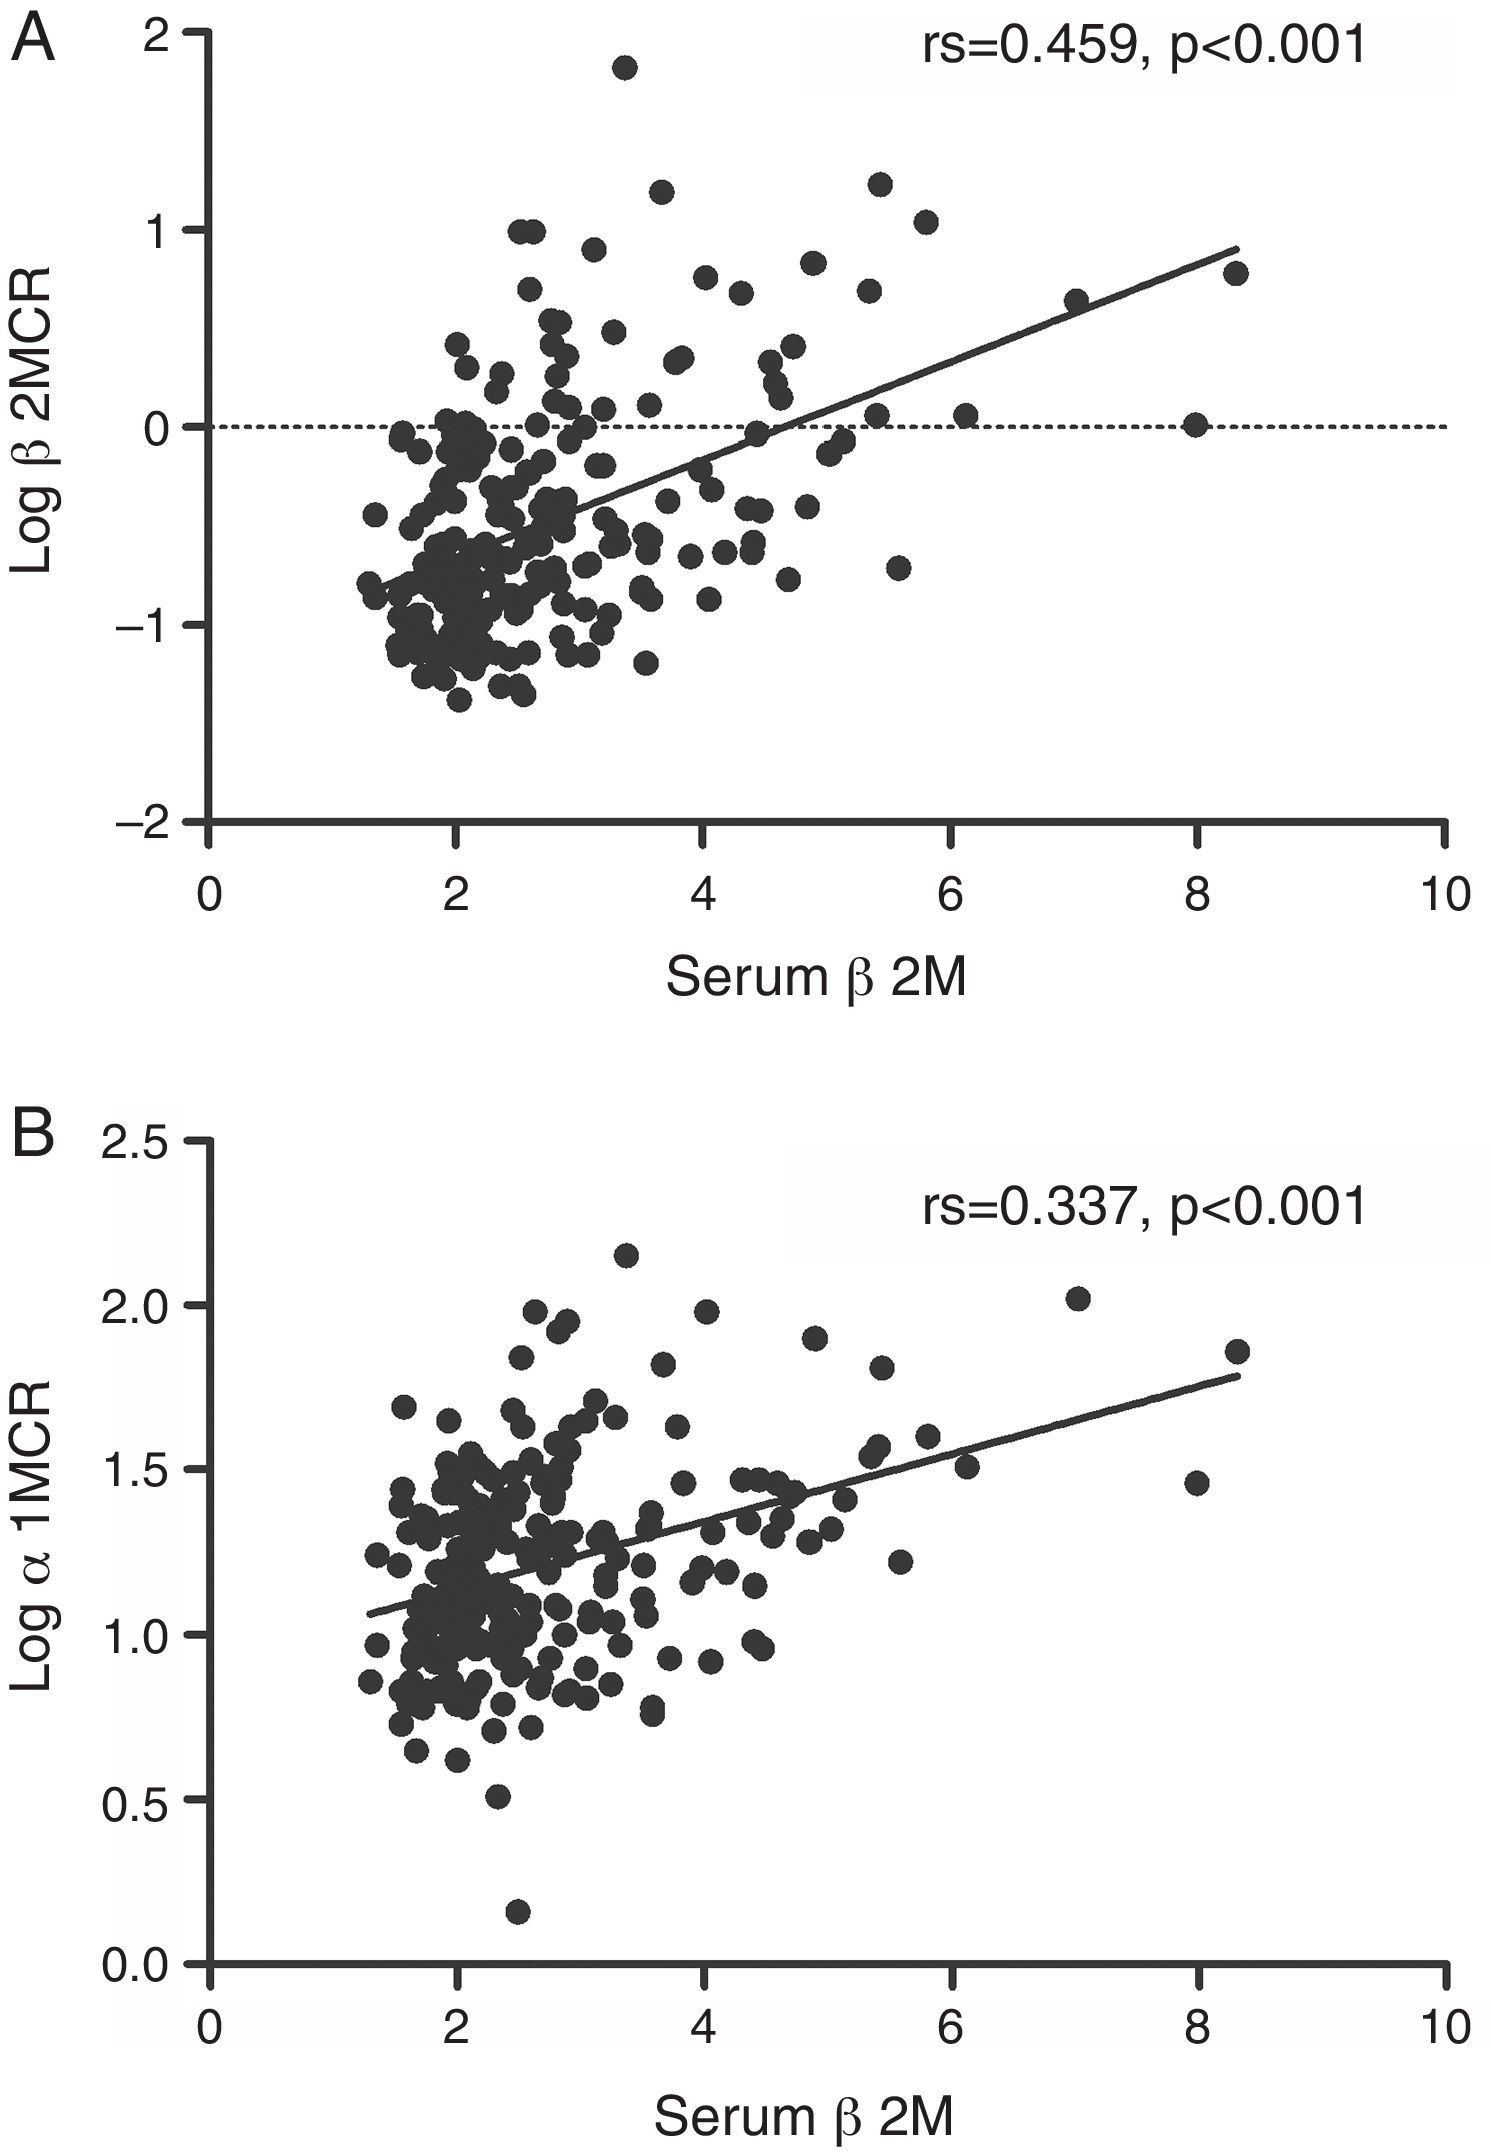
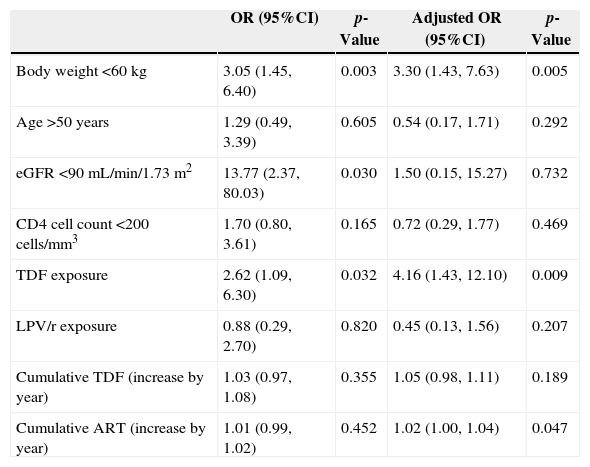
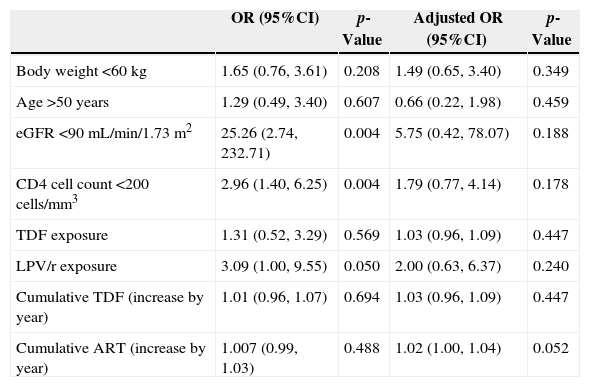
β2MCR and α1MCR (in urine) were both correlated with serum β2M (Fig. 2A and B, all p<0.001). In multivariate analyses, TDF exposure (OR 2.62, 95%CI 1.09, 6.30), body weight <60kg (OR 3.05, 95%CI 1.45, 6.40), and an eGFR <90mL/min/1.73m2 (OR 13.77, 95%CI 2.37, 80.03) were associated with UQ α1MCR; after adjusting for serum β2M, TDF exposure (OR 4.16, 95%CI 1.43, 12.10), body weight <60kg (OR 3.30, 95%CI 1.43, 7.63), and the cumulative time on ART (OR 1.02, 95%CI 1.00, 1.04) were related to UQ α1MCR (Table 3). Moreover, protease inhibitor exposure (OR 3.09, 95%CI 1.00, 9.55), CD4 cell count <200cells/mm3 (OR 2.96, 95%CI 1.40, 6.25), and eGFR <90mL/min/1.73m2 (OR 25.26, 95%CI 2.74, 232.71) were associated with UQ β2MCR; after adjusting for serum β2M, only cumulative time on ART (OR 1.02, 95%CI 1.00, 1.04) was related to UQ β2MCR (Table 4). Factors with too low prevalence, such as diabetes (2.5%) and hypertension (2.9%), were not included in the analysis.
, α1MCR and serum β2M (B). β2MCR, beta2-microglobulin-to-creatinine ratio; α1MCR, alpha1-microglobulin-to-creatinine ratio.")
Factors associated with upper quartile (UQ) α1MCR in multivariate analysis (unadjusted or adjusted by serum β2M).
| OR (95%CI) | p-Value | Adjusted OR (95%CI) | p-Value | |
|---|---|---|---|---|
| Body weight <60kg | 3.05 (1.45, 6.40) | 0.003 | 3.30 (1.43, 7.63) | 0.005 |
| Age >50 years | 1.29 (0.49, 3.39) | 0.605 | 0.54 (0.17, 1.71) | 0.292 |
| eGFR <90mL/min/1.73 m2 | 13.77 (2.37, 80.03) | 0.030 | 1.50 (0.15, 15.27) | 0.732 |
| CD4 cell count <200cells/mm3 | 1.70 (0.80, 3.61) | 0.165 | 0.72 (0.29, 1.77) | 0.469 |
| TDF exposure | 2.62 (1.09, 6.30) | 0.032 | 4.16 (1.43, 12.10) | 0.009 |
| LPV/r exposure | 0.88 (0.29, 2.70) | 0.820 | 0.45 (0.13, 1.56) | 0.207 |
| Cumulative TDF (increase by year) | 1.03 (0.97, 1.08) | 0.355 | 1.05 (0.98, 1.11) | 0.189 |
| Cumulative ART (increase by year) | 1.01 (0.99, 1.02) | 0.452 | 1.02 (1.00, 1.04) | 0.047 |
eGFR, estimated glomerular filtration rate; TDF, tenofovir disoproxil fumarate; LPV/r, lopinavir/ritonavir; ART, antiretroviral therapy.
Factors associated with upper quartile (UQ) β2MCR in multivariate analysis (unadjusted or adjusted by serum β2M).
| OR (95%CI) | p-Value | Adjusted OR (95%CI) | p-Value | |
|---|---|---|---|---|
| Body weight <60kg | 1.65 (0.76, 3.61) | 0.208 | 1.49 (0.65, 3.40) | 0.349 |
| Age >50 years | 1.29 (0.49, 3.40) | 0.607 | 0.66 (0.22, 1.98) | 0.459 |
| eGFR <90mL/min/1.73 m2 | 25.26 (2.74, 232.71) | 0.004 | 5.75 (0.42, 78.07) | 0.188 |
| CD4 cell count <200cells/mm3 | 2.96 (1.40, 6.25) | 0.004 | 1.79 (0.77, 4.14) | 0.178 |
| TDF exposure | 1.31 (0.52, 3.29) | 0.569 | 1.03 (0.96, 1.09) | 0.447 |
| LPV/r exposure | 3.09 (1.00, 9.55) | 0.050 | 2.00 (0.63, 6.37) | 0.240 |
| Cumulative TDF (increase by year) | 1.01 (0.96, 1.07) | 0.694 | 1.03 (0.96, 1.09) | 0.447 |
| Cumulative ART (increase by year) | 1.007 (0.99, 1.03) | 0.488 | 1.02 (1.00, 1.04) | 0.052 |
eGFR, estimated glomerular filtration rate; TDF, tenofovir disoproxil fumarate; LPV/r, lopinavir/ritonavir; ART, antiretroviral therapy.
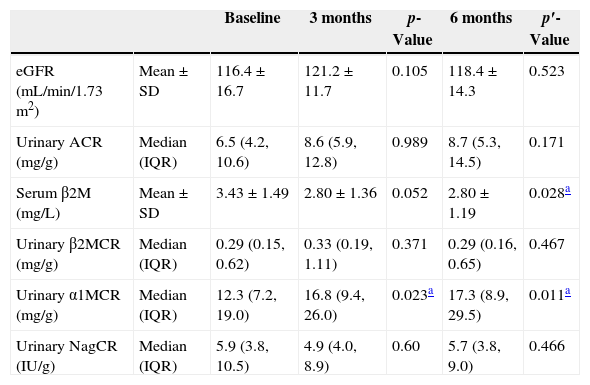
To further study the impact of TDF on kidney function, we followed-up 56 MSM from the non-ART group who started TDF/3TC/EFV. As shown in Table 5, α1MCR was the only urinary biomarker that dramatically increased after three and six months on TDF-containing therapy compared to baseline data (p=0.023 and 0.011, respectively). There was a slight increasing trend of β2MCR (in the urine) at three months, but it disappeared at six months (all p>0.05), concurrent with a significant decrease in β2M after six months of ART (p=0.028).
Longitudinal observation of urinary biomarkers in patients exposed to TDF-containing regimen.
| Baseline | 3 months | p-Value | 6 months | p′-Value | ||
|---|---|---|---|---|---|---|
| eGFR (mL/min/1.73m2) | Mean±SD | 116.4±16.7 | 121.2±11.7 | 0.105 | 118.4±14.3 | 0.523 |
| Urinary ACR (mg/g) | Median (IQR) | 6.5 (4.2, 10.6) | 8.6 (5.9, 12.8) | 0.989 | 8.7 (5.3, 14.5) | 0.171 |
| Serum β2M (mg/L) | Mean±SD | 3.43±1.49 | 2.80±1.36 | 0.052 | 2.80±1.19 | 0.028a |
| Urinary β2MCR (mg/g) | Median (IQR) | 0.29 (0.15, 0.62) | 0.33 (0.19, 1.11) | 0.371 | 0.29 (0.16, 0.65) | 0.467 |
| Urinary α1MCR (mg/g) | Median (IQR) | 12.3 (7.2, 19.0) | 16.8 (9.4, 26.0) | 0.023a | 17.3 (8.9, 29.5) | 0.011a |
| Urinary NagCR (IU/g) | Median (IQR) | 5.9 (3.8, 10.5) | 4.9 (4.0, 8.9) | 0.60 | 5.7 (3.8, 9.0) | 0.466 |
p-Value for comparison between baseline and 3 months of ART, and p′-value for comparison between baseline and 6 months of ART.
In an era in which early ART and pre-exposure prophylaxis are generally encouraged,17 TDF use and its nephrotoxicity are likely to draw increasing attention.18 In HIV-infected females, some urinary biomarkers were related to TDF use and could forecast declining kidney function.19,20 Among HIV-infected MSM, we observed a higher rate of α1M and β2M proteinuria in TDF users in a cross-sectional study and confirmed urinary α1M elevation after TDF exposure in a longitudinal study. HIV-seronegative MSM were found to have a small but significant decrease in creatinine clearance after TDF exposure,21 but novel urinary biomarkers among this population have not been evaluated. Our findings underscored the importance of subclinical renal function monitoring in HIV-infected MSM treated with TDF, and the findings might also give clues for early detection of TDF-related toxicity in non-infected MSM.
Here we chose four urinary candidate markers to indicate early renal dysfunction: albuminuria is a classical indicator of early glomerular injury;22 α1M, β2M, and NAG are tubular biomarkers, but their role in diagnosing and monitoring early tubular damage is still undetermined. Of all of the selected markers, urinary α1M seems to be the most reliable for determining TDF-associated renal dysfunction in several ways. First, urinary α1M was the only biomarker that could distinguish the TDF group from the other two control groups in the cross-sectional study. Second, α1M was also the only marker with notable elevation after ART initiation assessed in the longitudinal study. In a review paper, TDF-related renal damage usually appears within 5–12 months after initiation of therapy.23 Our observation confirmed the sensitivity of urinary α1M, which increased significantly already after three months of TDF-containing therapy. Third, we observed no significant differences in albumin or NAG in cross-sectional or longitudinal studies. Urinary β2M might also be a helpful biomarker, which has been recommended along with urinary α1M as a useful screening tool for TDF-induced kidney tubulopathy in a diagnostic accuracy study,10 and showed a higher rate of proteinuria in the TDF group than the non-TDF group in our study. However, urinary β2M is highly dependent on serum β2M and the pH value of the urine.24,25 Unlike β2M, which is unstable in acidic urine, α1M has been reported to be very stable in urine at different pHs.26
It is worth mentioning that the inflammatory status of HIV infection may disturb the interpretation of urinary biomarkers in tubular dysfunction because α1M and β2M are both inflammatory biomarkers.26,27 In our observation, urinary α1MCR and β2MCR were both correlated to serum β2M, which is a non-specific marker of chronic inflammation and could be increased even after ART.27,28 However, serum β2M seemed to have a stronger effect on urinary β2MCR than urinary α1MCR. In multivariate analyses, TDF exposure was an independent risk factor for UQ α1MCR before and after serum β2M adjustment. By contrast, after adjusting for serum β2M, all traditional risk factors of tubular proteinuria29 lost their significance in association with UQ β2MCR. In the longitudinal study, we also observed elevated α1MCR levels after three and six months on TDF exposure, but no obvious change was found in β2MCR after ART, probably due to the decreased level of serum β2M. Nevertheless, in another study with a longer observation time after TDF than in our study, urinary β2M was highly elevated.19 It reminds us that urinary β2M may still be a useful marker after long-term TDF exposure and encourages further study.
Our study provided information about the presence of early renal dysfunction in Chinese HIV-infected patients. Compared with another HIV-infected cohort of African Americans and Caucasians in America, our patients had a lower rate of albuminuria (12.1% versus 28%). A recent study in Germany reported a higher rate of albuminuria (20%), but a lower rate of tubular proteinuria (41%) than that seen in our study (54.4%), as measured by their definition (α1MCR >14mg/g).30 More studies using similar biomarkers and criteria of early renal dysfunction are needed. Additionally, because TDF only became a first-line drug to treat naive patients in China in 2012, future studies are required to determine its long-term toxicity in Chinese patients.
ConclusionUrinary α1M seems to be a promising biomarker for early detection of TDF-associated tubular dysfunction among HIV-infected MSM. Urinary β2M may help indicate tubular dysfunction, but its clinical interpretation should also take inflammatory conditions into account. More studies will be necessary to address the clinical role of these biomarkers in diagnosing and monitoring TDF-associated tubular injury.
FundingThis study was supported by the National Natural Science Foundation of China (81201345).
Conflicts of interestThe authors declare no conflicts of interest.
Equal contributors.
This study was supported by the Mega-Projects of National Science Research for the 12th Five-Year Plan (2013ZX09303002), Clinical Research Platform Construction of Hepatitis, Tuberculosis and other major diseases (2013225079), and the National Natural Science Foundation of China (81201345).
- SARS-CoV-2 and dialysis: humoral response, clinical and laboratory impacts before vaccination
- Navigating the waves in Colombia: a cohort study of inpatient care during four COVID-19 waves
- Comparative analysis of SARS-CoV-2 variants Alpha (B.1.1.7), Gamma (P.1), Zeta (P.2) and Delta (B.1.617.2) in Vero-E6 cells: ultrastructural characterization of cytopathology and replication kinetics
- Comparative analysis of asymptomatic infection prevalence in Beta, Delta, and Omicron surges of COVID-19
articles
