
It is recognized that hepatitis C virus subtypes (1a, 1b, 2a, 2b, 2c and 3a) originated in Africa and Asia and spread worldwide exponentially during the Second World War (1940) through the transfusion of contaminated blood products, invasive medical and dental procedures, and intravenous drug use. The entry of hepatitis C virus subtypes into different regions occurred at distinct times, presenting exponential growth rates of larger or smaller spread. Our study estimated the growth and spread of the most prevalent subtypes currently circulating in São Paulo.
MethodsA total of 465 non-structural region 5B sequences of hepatitis C virus covering a 14-year time-span were used to reconstruct the population history and estimate the population dynamics and Time to Most Recent Common Ancestor of genotypes using the Bayesian Markov Chain Monte Carlo approach implemented in BEAST (Bayesian evolutionary analysis by sampling tree software/program).
ResultsEvolutionary analysis demonstrated that the different hepatitis C virus subtypes had distinct growth patterns. The introduction of hepatitis C virus-1a and -3a were estimated to be circa 1979 and 1967, respectively, whereas hepatitis C virus-1b appears to have a more ancient entry, circa 1923. Hepatitis C virus-1b phylogenies suggest that different lineages circulate in São Paulo, and four well-supported groups (i.e., G1, G2, G3 and G4) were identified. Hepatitis C virus-1a presented the highest growth rate (r=0.4), but its spread became less marked after the 2000s. Hepatitis C virus-3a grew exponentially until the 1990s and had an intermediate growth rate (r=0.32). An evident exponential growth (r=0.26) was found for hepatitis C virus-1b between 1980 and the mid-1990s.
ConclusionsAfter an initial period of exponential growth, the expansion of the three main subtypes began to decrease. Hepatitis C virus-1b presented inflated genetic diversity, and its transmission may have been sustained by different generations and transmission routes other than blood transfusion. Hepatitis C virus-1a and -3a showed no group stratification, most likely due to their recent entry.
Hepatitis C virus (HCV) was identified by Choo et al. in 19891 and is currently a major cause of chronic hepatitis in the world, reaching 150 million carriers (2–3% of the world population), with approximately 3–4 million new infections and 350,000 deaths annually.2 HCV is thought to have originated in West Africa or Southern Asia, regions where endemic genotypes remained for hundreds of years (between 500 and 1000 years), with relatively low transmission rates, mainly via inefficient routes, such as sexual or vertical transmission, and by practices such as circumcision, excision, and scarification.3–8 Representatives from these endemic genotypes show high genetic variation among strains and are found in restricted geographic regions, including genotypes 1 and 4 in Central Africa, 2 in West Africa, 5 and 7 in Central/Southern Africa, and 3 and 6 on the Indian sub-continent and in South and East Asia.6,7,9–12 Some subtypes of endemic regions have spread to different regions and expanded globally. The epidemic subtypes (1a, 1b, 2a, 2b, 2c, and 3a) then spread exponentially during and after the Second World War (1940) when there was an increase of very efficient new ways of transmission, such as the transfusion of contaminated blood and blood products, invasive medical and dental procedures, and also intravenous drug use (IVDU).13–15 In addition to their wide distribution in the world, these subtypes are characterized by their high prevalence and low genetic variation.3,16,17
The risk of HCV transmission via blood transfusion was strikingly decreased after the introduction of anti-HCV serologic screening tests for blood donors. Additionally, the introduction of nucleic acid testing (NAT) for HCV screening further reduced the risk of transfusion-transmitted HCV.18,19 In contrast, the use of intravenous drugs remains one of the major risk factors for HCV infection,20 and sexual transmission, which generally showed low or inefficient transmission in the general population has also been associated with practices that lead to mucosal trauma and presence of ulcerative genital diseases.21,22
In Brazil, the prevalence of HCV among drug users may reach 36%.23–25 In the HIV co-infected population, it ranges between 18% and 31%.26,27 In the general population, the prevalence is approximately 1.5%28–30 and may vary from 0.19% to 1.2% in blood donors.31–36
In São Paulo State (Brazil), a predominance of epidemic subtypes is observed. HCV-1a corresponds to 32%–34.4% of all infected subjects, while HCV-1b is detected in 36.2%–45.5%, and HCV-3a in 18%–24.2%. Others genotypes such as 4 and 5 are rarely detected.37–39 The entry of the different HCV subtypes into São Paulo appears to have occurred on different dates, and each subtype appears to have grown at distinct rates.38,40,41 In this study, we sought to estimate the growth and spread of the most prevalent subtypes and to investigate the current situation of these subtypes in São Paulo.
Materials and methodsStudy populationSamples from two different studies were analyzed, comprising a period of 14 years (1997–2011): 580 partial sequences of the non-structural region 5B (NS5B) (IDs GQ490493–GQ491027) of patients from São Paulo State38 and 170 partial sequences of NS5B from blood donors of Fundação Pró-Sangue/Hemocentro de São Paulo (IDs KF523955–KF524152).37 The first study included patients from four different cities of São Paulo State (Ribeirão Preto, São José do Rio Preto, São Bernardo do Campo, and from two reference centers for HCV surveillance and treatment in São Paulo city) that were collected between 1997 and 2006 (IDs GQ490493–GQ491027). The frequency of major risk factors were 36% of blood transfusion history, 18% injecting drug users, and 32% that did not disclose any risk factor.38 The second study was conducted in blood donors screened from September 2007 to July 2011 in São Paulo city and although considered to be a population with low risk behavior 11% reported blood transfusion, 6% injecting drug use, and 20% no risk factors associated with HCV infection.37 The NS5B sequences were aligned using Clustal X and genotyped by maximum likelihood analysis using the GARLi program (Genetic Algorithm for Rapid Likelihood Inference). From this, three distinct datasets containing only São Paulo sequences were built, HCV-1a (n=98), HCV-1b (n=218) and HCV-3a (n=149), to investigate the population history of the samples. Other sequences were removed from the study. Additionally, a dataset containing 70 non-structural region 3 (NS3) sequences (708 nucleotides long) generated in the same study from HCV-1b-infected blood donors was constructed for further analysis (IDs KF524133–KF524257).
HCV phylodynamicsThe population dynamics and TMRCA (Time to Most Recent Common Ancestor) for the three genotypes were investigated using the Bayesian Markov Chain Monte Carlo (MCMC) approach implemented in the BEAST v 1.8 package.42 The least constrained Bayesian skyride (BSK) coalescent was used as a tree prior under a relaxed (uncorrelated) molecular clock with the best model of nucleotide substitution (GTR+G+I) estimated in MODELTEST.43 The substitution rate was set as previously estimated for each genotype.38 MCMC runs consisting of 50 million generations (with 10% burn-in) were undertaken to obtain parameter convergence. A maximum clade credibility (MCC) tree was obtained by summarizing the 50,000 trees with branch lengths of nucleotide substitution (after excluding 10% of the burn-in) using Tree Annotator v.1.7.2.42 The phylogenetic trees were visualized in FigTree v.1.2.2 (available at: http://tree.bio.ed.ac.uk/software/figtree).
We also aimed to estimate the rate of population growth (r) under the demographic model (exponential and logistic population growth) that best fit each subtype dataset, with model comparisons undertaken using Bayes Factor comparison. In all cases, the convergence of parameters during the MCMC runs was inspected with Tracer v.1.4,42 with uncertainties depicted as 95% highest probability (HPD) intervals.
Potential risk factors involved in HCV transmission such as a history of blood transfusion, tattooing, intravenous drug use, occupational exposure, and sexual behavior were analyzed in addition to demographics such as age, sex, race, and education.
Statistical analysisThe characteristics were evaluated according to the subgroups belonging to subtype 1b of blood donors. To compare the G1-G4 subgroups according to some demographic characteristics and related risk behaviors, we used chi-squared test of significance level of 5%.
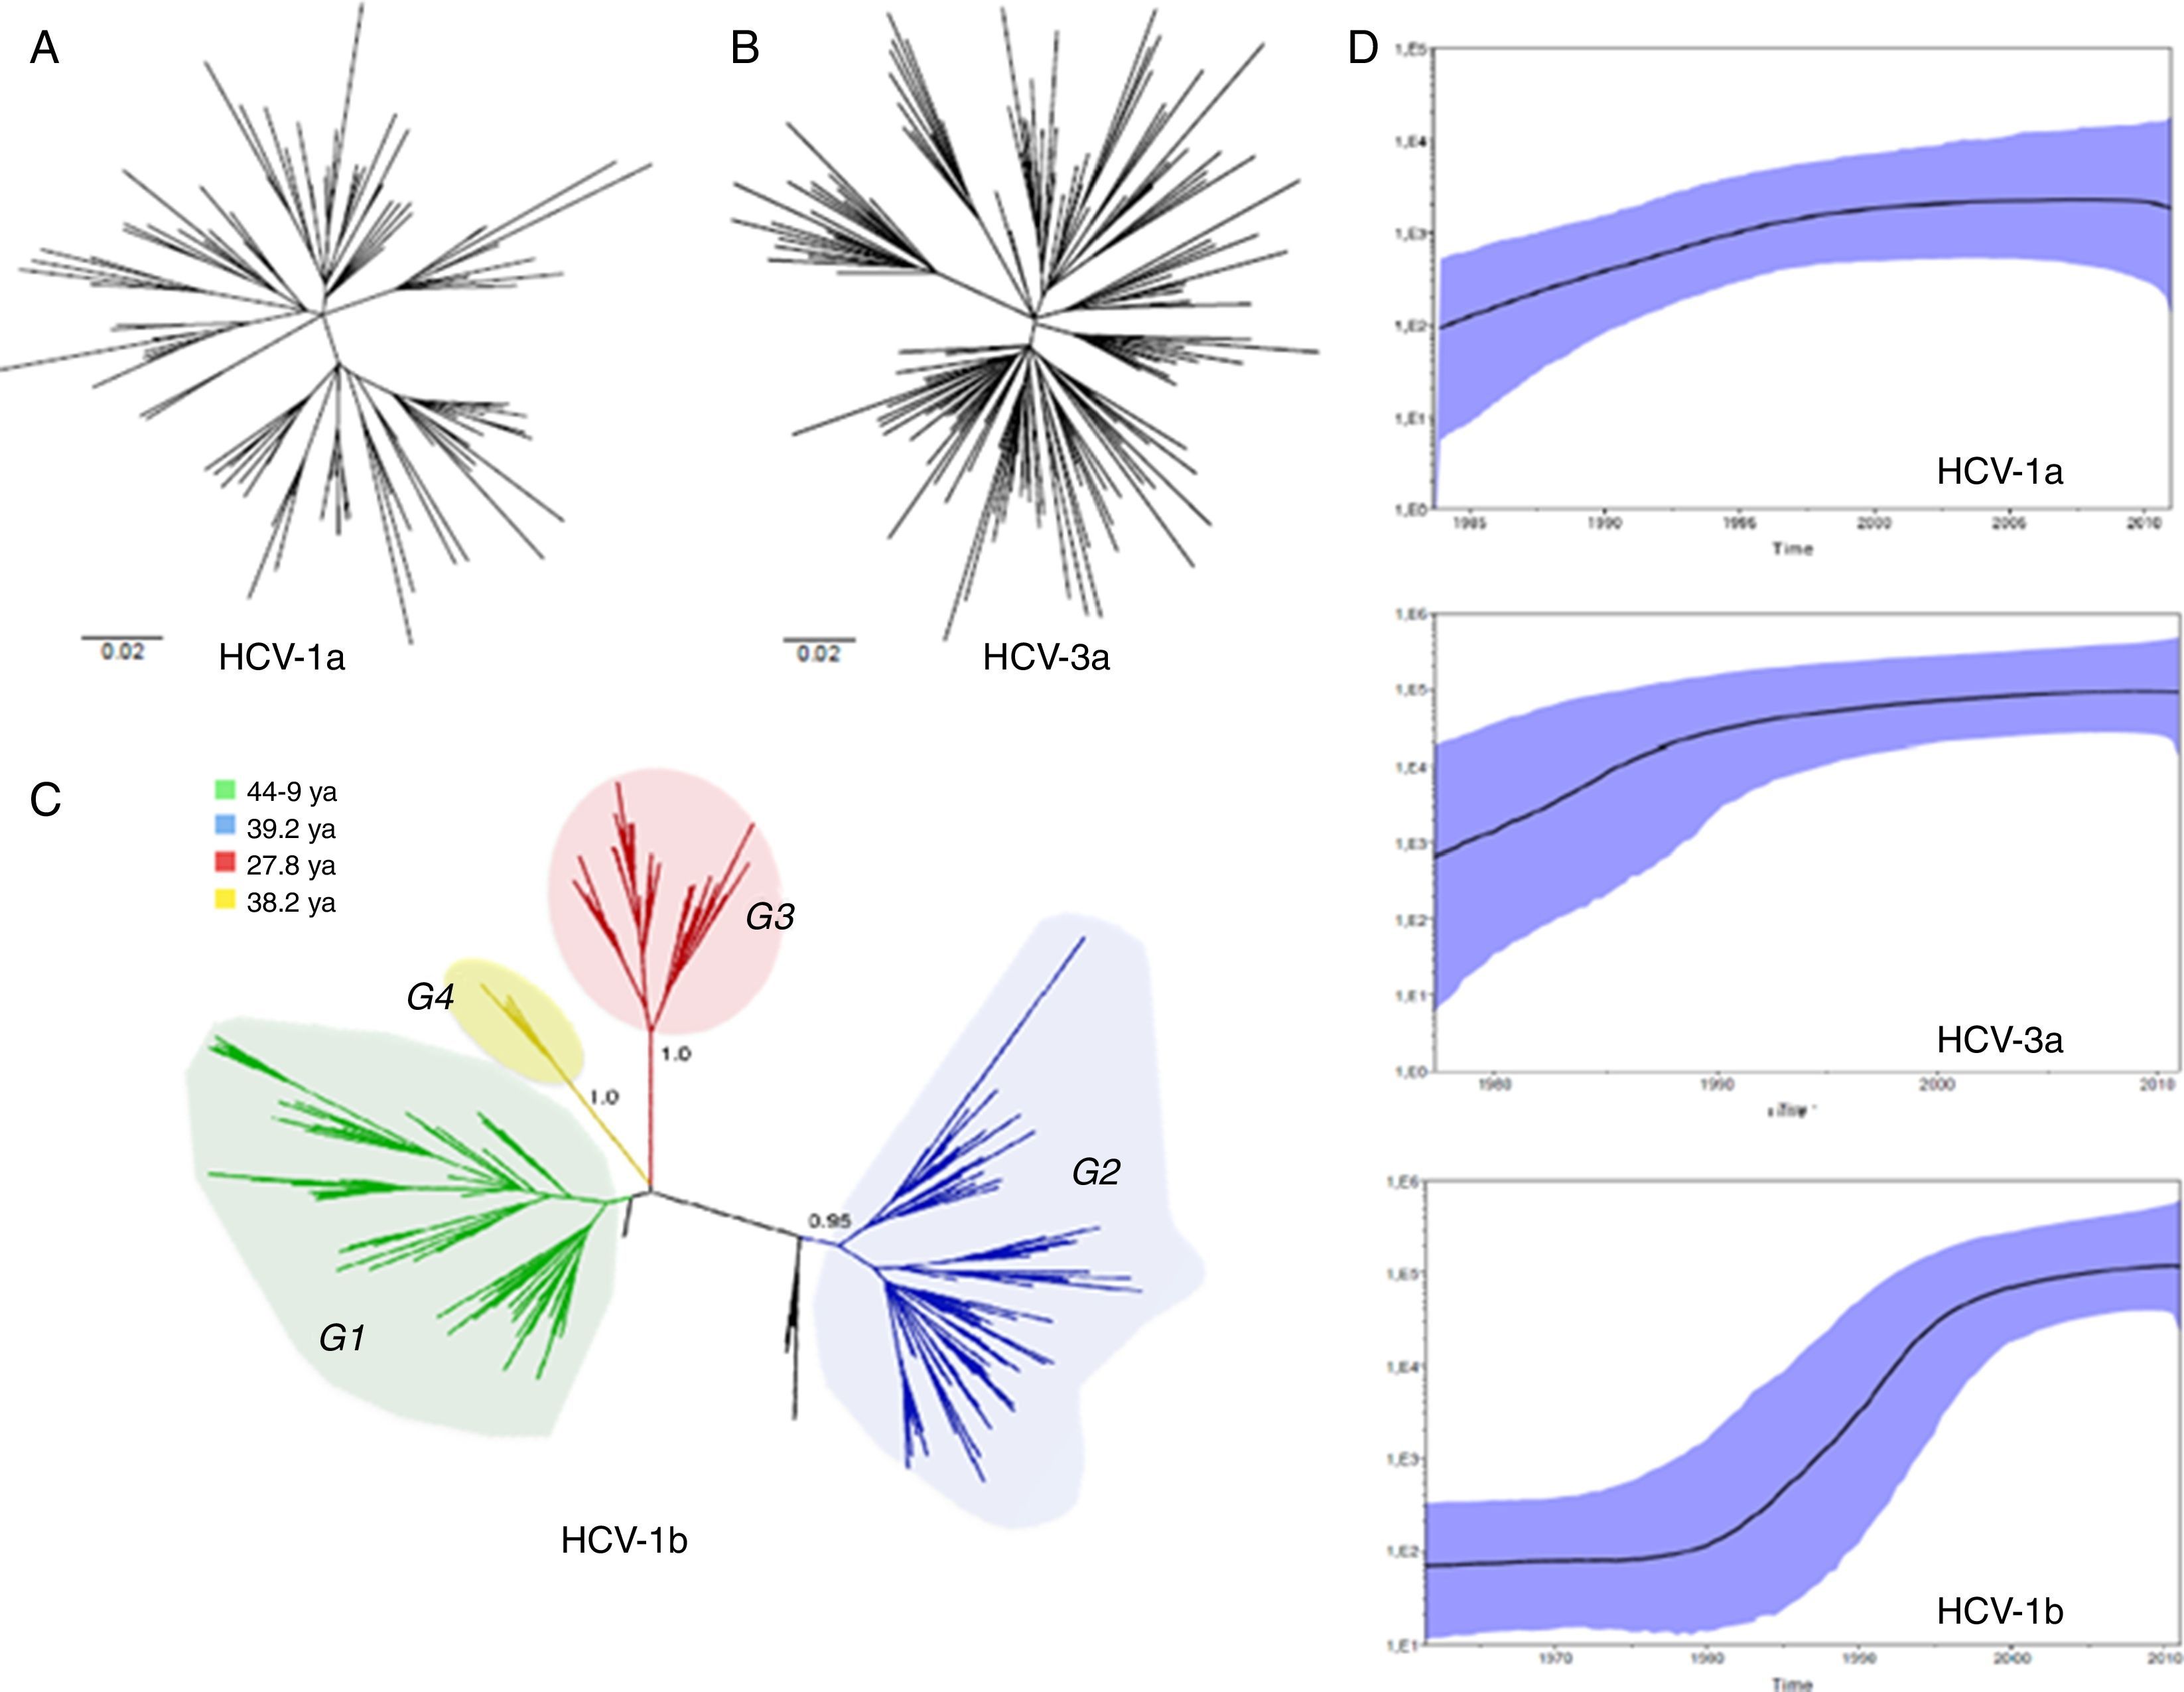
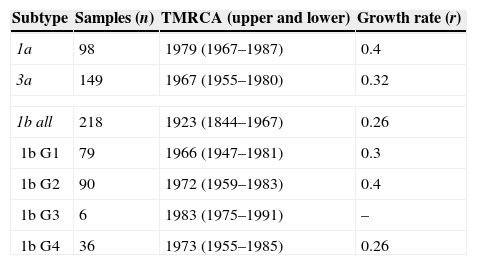
ResultsWe analyzed partial sequences of the NS5B gene belonging to the most prevalent subtypes in our population, subtypes 1a, 1b and 3a. After genotyping using worldwide sequences as references, we excluded all taxa that clustered with samples from outside Brazil. This was performed to reduce the effect of any phylogeographic structure on the further analysis of the transmission dynamics. By including only ‘Brazilian’ sequences, the evolutionary analysis demonstrated that the different subtypes have distinct growth patterns, as demonstrated by the tree shapes, and also confirmed the previous observation that they were introduced into São Paulo at different times. The TMRCAs for HCV-1a and -3a were estimated to be circa 1979 and 1967, respectively, and HCV-1b appeared to have a more ancient entry, circa 1923, which is very similar to the previous estimate38 (Table 1).
HCV subtypes and subgroup Time to Most Recent Common Ancestor (TMRCA) and rate of population growth.
| Subtype | Samples (n) | TMRCA (upper and lower) | Growth rate (r) |
|---|---|---|---|
| 1a | 98 | 1979 (1967–1987) | 0.4 |
| 3a | 149 | 1967 (1955–1980) | 0.32 |
| 1b all | 218 | 1923 (1844–1967) | 0.26 |
| 1b G1 | 79 | 1966 (1947–1981) | 0.3 |
| 1b G2 | 90 | 1972 (1959–1983) | 0.4 |
| 1b G3 | 6 | 1983 (1975–1991) | – |
| 1b G4 | 36 | 1973 (1955–1985) | 0.26 |
TMRCA, Time to Most Recent Common Ancestor; r, rate of population growth.
The growth rate was not estimated for G3 because it includes only six sequences.
Different from what the HCV-1a phylogeny suggests, the HCV-3a and HCV-1b phylogenies indicate that different lineages circulated in São Paulo (Fig. 1). However, although no support was observed for HCV-3a lineages, four well-supported groups, named Groups 1–4 (i.e., G1, G2, G3 and G4) were identified for HCV-1b (Fig. 1). To verify the consistency of the HCV-1b subgroups, we investigated the phylogenetic pattern of this subtype using the NS3 sequences obtained from the same samples generated in this study. Similar to the structure obtained for the NS5 gene, NS3 also depicted four well-supported groups (Fig. 1).
 HCV-1a and (B) HCV-3a MCC trees showing the classical star-shaped phylogenies. (C) HCV-1b MCC tree showing four well-supported groups named Groups 1–4. (D) Skyride plot showing the population dynamics and TMRCA for the NS5B HCV region of subtypes 1a, -1b and -3a. MCC, maximum clade credibility; TMRCA, time to most recent common ancestor.")
(A) HCV-1a and (B) HCV-3a MCC trees showing the classical star-shaped phylogenies. (C) HCV-1b MCC tree showing four well-supported groups named Groups 1–4. (D) Skyride plot showing the population dynamics and TMRCA for the NS5B HCV region of subtypes 1a, -1b and -3a. MCC, maximum clade credibility; TMRCA, time to most recent common ancestor.
Because the observed groups were very consistent in both phylogenies (NS5B and NS3), we also estimated the time of their emergence. Assuming as a prior the same evolutionary rate for all subgroups and using the NS5 dataset, we found that the subgroups did not differ significantly according to their emergence in São Paulo (because upper and lower values overlapped each other). Nevertheless, the median values suggested that Group 1 was the first to spread in this population (late 1960s), followed by Groups 2 and 4, which emerged at the same time around the beginning of the 1970s (Table 1). These subgroups (G1–G4) were not associated with gender, age, ethnicity, or education level, and there was no association between the subgroups and the different exposure categories, except for G2, which had entered in 1972 and was associated with a history of blood and blood product transfusion in 62.5% (5/8; p=0.043) of the carriers.
We also estimated the growth rate for HCV-1a, -1b (total and subgroups) and -3a using BEAST (Bayesian evolutionary analysis by sampling tree software/program) based on the best-fit demographic model for each NS5 dataset. The exponential growth model under the exponential relaxed (uncorrelated) molecular clock was the best for all datasets according to Bayes Factor. HCV-1a presented the highest growth rate among the subtypes (r=0.4), but accordingly to the skyride plot (Fig. 1), the spread has become less marked after the 2000s. HCV-3a, which is likely to have entered São Paulo some years before HCV-1a, grew exponentially until 1990 and had an intermediate growth rate (0.32) in comparison to HCV-1a and -1b (Table 1). The HCV-1b skyride clearly showed an evident exponential growth between 1980 and the mid-1990s, as already demonstrated by others.15,38
DiscussionHCV-3a and -1b display multiple lineages in São Paulo, indicating the simultaneous dissemination of multiple strains. However, only the HCV-1b lineages are well supported. HCV-1b showed four distinct subgroups, herein named G1 to G4, in accordance with the studies of Lampe et al.,41 who found five subgroups of subtype 1b. Interestingly, Lampe et al.41 found that those lineages were associated with geographical location (western and southeast regions of Brazil), and our sequences obtained from São Paulo also reflect such genetic isolation. Although no evident association between clinical or epidemiological relationships for such groups was found, we speculate that these lineages circulated within particular transmission groups restricted by factors yet to be determined. There was also no association between subgroup 1b and age, and the most likely hypothesis is that the circulation of these lineages occurred over a long period from the beginning of the 20th century (oldest subtype), which could have resulted in a “dilution” in the transmission of this subtype for different risk groups and different age groups. Unlike HCV-1a, the latest entry in our population showed a similar transmission within groups that share the same habits and the same age group.38 The data presented in this work appear to be robust because they are consistent with previous estimates that used sequences comprising a shorter time span (nine years). The larger number of sequences as well the time span (14 years) did not alter the growth rates or coalescent times of the main HCV subtypes in São Paulo.
In fact, the findings for HCV-1b (especially the periods of exponential growth and decrease) coincide with historical events such as the foundation of the first blood bank and improvements in blood transfusion services, 1940–1960,44 and the simultaneous increase in medical procedures such as hemodialysis in 1960.45 Conversely, measures to prevent transmissible agents in blood, such as hepatitis B virus and human immunodeficiency virus, in the late 1980s and the obligatory serological screening in blood banks for HCV in 1993 contributed to the reduction and stabilization of the epidemic after 1990. The observed pattern of expansion is very similar to that found by Magiorkinis et al.15 in the USA, where subtype 1b showed a TMRCA of 1922 and an exponential increase. After the Second World War, transfusions and invasive medical procedures as well as therapeutic injections were widespread until the 1980s. At this time, an increased awareness of parenteral risk and the selection and screening of blood donors for HBsAg, ALT, anti-HBc, and anti-HIV resulted in the reduction of the risk of HCV transmission, even before the implementation of the anti-HCV test in 1990.19
Although introduced more recently than the subtype -1b, HCV-3a spread exponentially until 1990; the worldwide subtype 3a epidemic most likely began in the mid-20th century, had a common origin and quickly spread globally among drug users.46,47 Some studies have associated genotype 3 with IVDU and also with the use of stimulant medications (IV non-illicit drugs such as Gluconergan) in the 1970s.48 The association with these groups would most likely explain the high frequency of this subtype in the older group (>40 years) in this population.37 The decline in needle sharing and the frequency of injections and increasing educational measures might have contributed to reducing this risk of parenteral exposure in the early 1990s.49
HCV-1a was found to be the most recently introduced subtype in our region and showed the highest growth rate compared with other subtypes. Unlike subtype 1b that had a decline of the spread after mandatory serological screening for HBV, HIV, and HCV at the end of the 1980s in Brazilian blood banks, subtype 1a showed an increase in the spread as demonstrated in exponential expansion curve (in Skyride plot) in the mid-1990s, which continued until 2005. So, the main route of HCV-1a transmission is probably not blood transfusion, but UDIV.
Some authors have associated subtype 1a with the use of intravenous drugs,15,40,48,49 and even young individuals or short-time drug users (recent) could be more associated with needle sharing and contributing to the spread of this subtype 1a in this age group.24,50 This is in accordance with an increase in the frequency of subtype 1a among younger donors (<30 years).37
Our data clearly show that after an initial period of exponential growth, the expansion of the three main subtypes began to decrease as a consequence of the introduction of anti-HCV screening tests and political and educational measures avoiding needle sharing among IVDUs. The delay observed in BSK for HCV-1b decline appears to be the consequence of two possible and non-exclusive hypotheses: (i) the inflated genetic diversity in the tree caused by the concomitant circulation of at least four monophyletic strains, and (ii) as HCV-1b is the most ancient and most prevalent subtype in São Paulo, where it was first spread by transfusion route and its transmission was sustained by different generations through routes that allowed spread of 4 lineages (G1–G4) forming groups restricted by factors yet to be determined. HCV-1a and -3a showed low genetic variation, in accordance with their recent entry.
Conflict of interestThe authors declare no conflicts of interest.
This study was supported by CAPES (Coordenação de Aperfeiçoamento de Pessoal de Nível Superior) of Brazilian Ministry of Education and by Fundação Pró-Sangue/Hemocentro de São Paulo.
