HIV infection harms adaptive cellular immunity mechanisms. Long-term virological control by combined antiretroviral therapy (cART) reduces the risk of mycobacterial infections. Thus, we aimed to study cellular responses to mycobacterial antigens in 20 HIV-infected adolescents with at least one year of virological control (HIV-RNA <40 copies/mL) and 20 healthy adolescents.
MethodsWe evaluated CD8 and γδ T-cell degranulation by measurement of CD107a membrane expression after stimulation with lysates from BCG (10 μg/mL) and H37RA Mycobacterium tuberculosis (Mtb, 10 μg/mL). Immune activation and antigen-presenting ability were also assessed by determination of HLA-DR, CD80, and CD86 markers.
ResultsTCR γδ T-cell CD107a expression was similar between groups in response to mycobacterial antigens, and lower in the HIV-infected group in response to mitogen. Higher baseline HLA-DR expression and lower mycobacterial-stimulated expression was found within the HIV-infected group.
ConclusionsSimilar degranulation in stimulated CD8+ and TCR γδ T-cells from HIV-infected adolescents, when compared to healthy controls suggests long-term immunological preservation with immune reconstitution under successful cART. However, differences in HLA-DR expression may represent ongoing inflammation and lower specific responses in HIV-infected youth. These features may be relevant in the context of the precocity and severity of vertically acquired HIV infection.
Although the production of interferon-gamma by CD4+ T lymphocytes may perform a central role in the development of the immunity against Mycobacterium tuberculosis,1 a subpopulation of T lymphocytes called Gamma-Delta (TCR-γδ) also plays a significant role, not yet completely defined, in mycobacterial infections. Empirical data support that these cells promote important effector functions such as proliferation, release of T helper type 1 cytokines and cytotoxic activity.2
TCR-γδ may acquire the ability to process and to present antigens. Experimentally, TCR-γδ are capable of expression of the antigen presenting phenotype characterized by the HLA-DR, CD80 and CD86 markers. The magnitude of this expression is comparable to that observed in dendritic cells, considered professional APCs (antigen presenting cells) standards.3 Although there are results suggesting a specific role for TCR-γδ in the activation of αβ T cells, the relevance of TCR-γδ capacity to act as APCs has yet to be confirmed in vivo.3,4
In tuberculosis, human TCR-γδ can produce different functional responses. Cells stimulated by Bacillus–Calmette–Guérin (BCG) or mycobacterial lysates can produce cytotoxic granules (granulisins) and other antimicrobial peptides, and show cytolytic activity after co-culture with human monocytes infected with mycobacteria.5
Additionally, the production of granules by cytotoxic T lymphocytes (CD8+) and TCR-γδ has been characterized as an important adjuvant mechanism. Proteins such as perforin, granzyme B and granulisin have the property of lysing cells infected by M. tuberculosis, or even directly lysing the bacilli.6
The coinfection of Human Immunodeficiency Virus (HIV) and tuberculosis results in the enhancement of the activity of both diseases.7 HIV infection affects several mechanisms of the immune response, including T CD4, dendritic cells and TCR-γδ, contributing to the loss of immune competence. HIV infection may directly impact the repertoire and effector function of TCR-γδ.8 Moreover, there is a loss of phosphoantingen recognition ability of TCR-γδ, which could affect their function as APCs,9,10 and reduction of cytotoxic granules production by T CD8 cells, which could be recovered with antiretroviral therapy.11
About 20 years ago, with the introduction of combined antiretroviral therapy (cART), control of HIV infection allowed a highly lethal disease to be seen as a chronic condition. HIV-infected individuals currently have encouraging prospects for good survival and quality of life.12 Young people infected by vertical transmission present infection activity from the beginning of life. cART has significant efficacy in this population, but the preservation of immune function may be incomplete.13 Based on this scenario, our study aimed to evaluate the antigen-presenting and activation phenotypes and the capacity to produce cytotoxic granules in response to mycobacterial antigens by CD8+ and TCR-γδ in a sample of young people infected with HIV by vertical transmission, vaccinated with BCG in childhood.
MethodsStudy participantsIn this prospective cross-sectional study, 20 individuals, aged 16–23 years, were recruited at the Pediatric Immunodeficiency Outpatient Unit at the State University of Campinas (Unicamp) Hospital (Campinas, Brazil) from a cohort of 140 children and adolescents vertically infected with HIV-1. HIV infection was established according to international standards, endorsed by the Brazilian Ministry of Health Criteria.14 Inclusion criteria required that all HIV-infection patients were on cART and had viral replication control (undetected plasma viral loads) for at least one year. Patients with acute infections were not included. All patients were immunized with BCG vaccine at childhood, according to Brazilian Ministry of Health guidelines.14
Additionally, 20 healthy volunteers with comparable age and with a history of vaccination with BCG at childhood participated as controls.
Blood collection and laboratory procedures were performed from September 2016 to March 2017.
The study protocol was approved by the State University of Campinas Research Ethics Committee. Written informed consent was obtained from each control and patient, or from legal guardians, for underage patients or controls.
Peripheral blood immunophenotyping, complete blood count (CBC) and HIV-1 viral loadOne milliliter of peripheral blood was collected in ethylene diaminetetracetic acid tubes to perform a CBC (KX-21 automated hematology analyzer, Sysmex, USA), CD3-APCH7 (clone SK7), CD4-BB515 (clone RPA-T4), CD8-PercpCy5.5, and TCRγδ-PE immunophenotyping (FACSVerse flow cytometer, BD Biosciences, USA). The Abbott RealTime HIV-1 kit and Abbott m2000rt instrument, Promega Corporation, USA, were used to quantify plasma HIV-1 RNA, with the lower limit of detection of 40 RNA copies/mL.
Antigens used in the cell cultures assayMycobacterium bovis (Bacillus Calmette-Guérin Moreau) and M. tuberculosis lysates were supplied by the Section of Microbiology at the Laboratory of Pathology of Unicamp Hospital, and used at 10 µg of total protein/mL of culture. Phytohemagglutinin (PHA, Sigma, USA) was used as a positive control for degranulation, and medium alone as a negative control.
Biomarker assaysTwenty milliliter of heparinized peripheral blood were collected for culture assay. Fresh peripheral blood mononuclear cells (PBMC) were isolated by density gradient centrifugation over Ficoll-Paque Plus (GE Healthcare, Sweden), diluted to 1 × 10⁶ cells/mL in RPMI 1640 medium (Gibco™, Thermo Fisher Scientific, USA) supplemented with 10% human AB serum (Sigma, USA), 10 µL/mL of gentamycin, CD28 and CD49d (1 μg/mL each — BD Biosciences, USA), and stimulated Mycobacterium antigens, PHA or medium medium alone for 18 h at 37 °C with 5% CO2 in round-bottomed tubes (BD, USA).
In the final four hours, CD107a (BD Horizon™, BV510) was added to quantify the degranulation of cells.
At the end of the 18 h culture, the samples were ressuspended and marked with fluorescence-conjugated antibodies directed against surface antigens. The following antibodies were used: CD3-APCH7, CD8-PercpCy5.5, TCRγδ-FITC, HLA-DR-BV421, CD80-PE and CD86-APC (all from BD Biosciences, USA).
The cells were acquired in FACSVerse flow cytometer (BD biosciences) with FACS suite software. For the acquisition, leukocytes were gated in forward scatter (FSC) versus side scatter (SSC), and doublets were excluded (FSC-area x FSC-height). T cells were identified by assessing CD3 expression using SSC parameters and 10,000 events were acquired from this gate. T lymphocyte subpopulations were differentiated from a double stained CD3/CD8+, CD3/TCRγδ+.
Analyses were performed with FlowJo™ software (version 7.6.5 – Treestar, Ashland, USA).
Statistical considerationsStatistical analysis was performed with SPSS® for Windows software (version 16.0.0, USA) using Mann-whitney (MW) test. All reported p-values were two-tailed, and significant levels established at ≤0.05. Outcomes were compared between HIV-infected and control groups, and also, within the HIV-infected group, according to immunologic classes, which were defined by pre-cART nadir CD4+ counts.14,15 Centers for Disease Control and Prevention (CDC) classes 1 and 2 were consolidated, and compared to class 3.
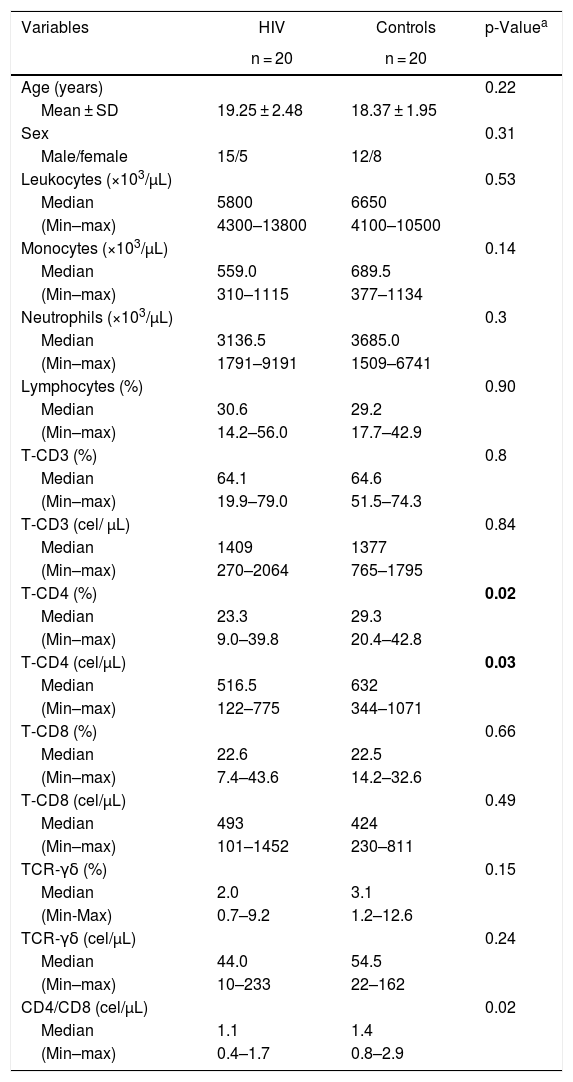
ResultsStudy participants and laboratory dataTable 1 shows demographical and laboratory characteristics from 20 healthy controls and 20 HIV-infected patients. There was no significant difference in age between the groups. The control group had higher TCD4+ counts, either absolute, percent or in relation to TCD8+ counts (MW, p = 0.03, 0.02 and 0.02, respectively), in comparison with the patient group. All patients had undetectable HIV-1 viral loads and optimal TCD4+ recovery by long term cART at the moment of blood collection.
Demographic and laboratory data from HIV-infected patients and healthy controls.
| Variables | HIV | Controls | p-Valuea |
|---|---|---|---|
| n = 20 | n = 20 | ||
| Age (years) | 0.22 | ||
| Mean ± SD | 19.25 ± 2.48 | 18.37 ± 1.95 | |
| Sex | 0.31 | ||
| Male/female | 15/5 | 12/8 | |
| Leukocytes (×103/µL) | 0.53 | ||
| Median | 5800 | 6650 | |
| (Min–max) | 4300–13800 | 4100–10500 | |
| Monocytes (×103/µL) | 0.14 | ||
| Median | 559.0 | 689.5 | |
| (Min–max) | 310–1115 | 377–1134 | |
| Neutrophils (×103/µL) | 0.3 | ||
| Median | 3136.5 | 3685.0 | |
| (Min–max) | 1791–9191 | 1509–6741 | |
| Lymphocytes (%) | 0.90 | ||
| Median | 30.6 | 29.2 | |
| (Min–max) | 14.2–56.0 | 17.7–42.9 | |
| T-CD3 (%) | 0.8 | ||
| Median | 64.1 | 64.6 | |
| (Min–max) | 19.9–79.0 | 51.5–74.3 | |
| T-CD3 (cel/ µL) | 0.84 | ||
| Median | 1409 | 1377 | |
| (Min–max) | 270–2064 | 765–1795 | |
| T-CD4 (%) | 0.02 | ||
| Median | 23.3 | 29.3 | |
| (Min–max) | 9.0–39.8 | 20.4–42.8 | |
| T-CD4 (cel/µL) | 0.03 | ||
| Median | 516.5 | 632 | |
| (Min–max) | 122–775 | 344–1071 | |
| T-CD8 (%) | 0.66 | ||
| Median | 22.6 | 22.5 | |
| (Min–max) | 7.4–43.6 | 14.2–32.6 | |
| T-CD8 (cel/µL) | 0.49 | ||
| Median | 493 | 424 | |
| (Min–max) | 101–1452 | 230–811 | |
| TCR-γδ (%) | 0.15 | ||
| Median | 2.0 | 3.1 | |
| (Min-Max) | 0.7–9.2 | 1.2–12.6 | |
| TCR-γδ (cel/µL) | 0.24 | ||
| Median | 44.0 | 54.5 | |
| (Min–max) | 10–233 | 22–162 | |
| CD4/CD8 (cel/µL) | 0.02 | ||
| Median | 1.1 | 1.4 | |
| (Min–max) | 0.4–1.7 | 0.8–2.9 |
p-values marked in bold indicate significant results.
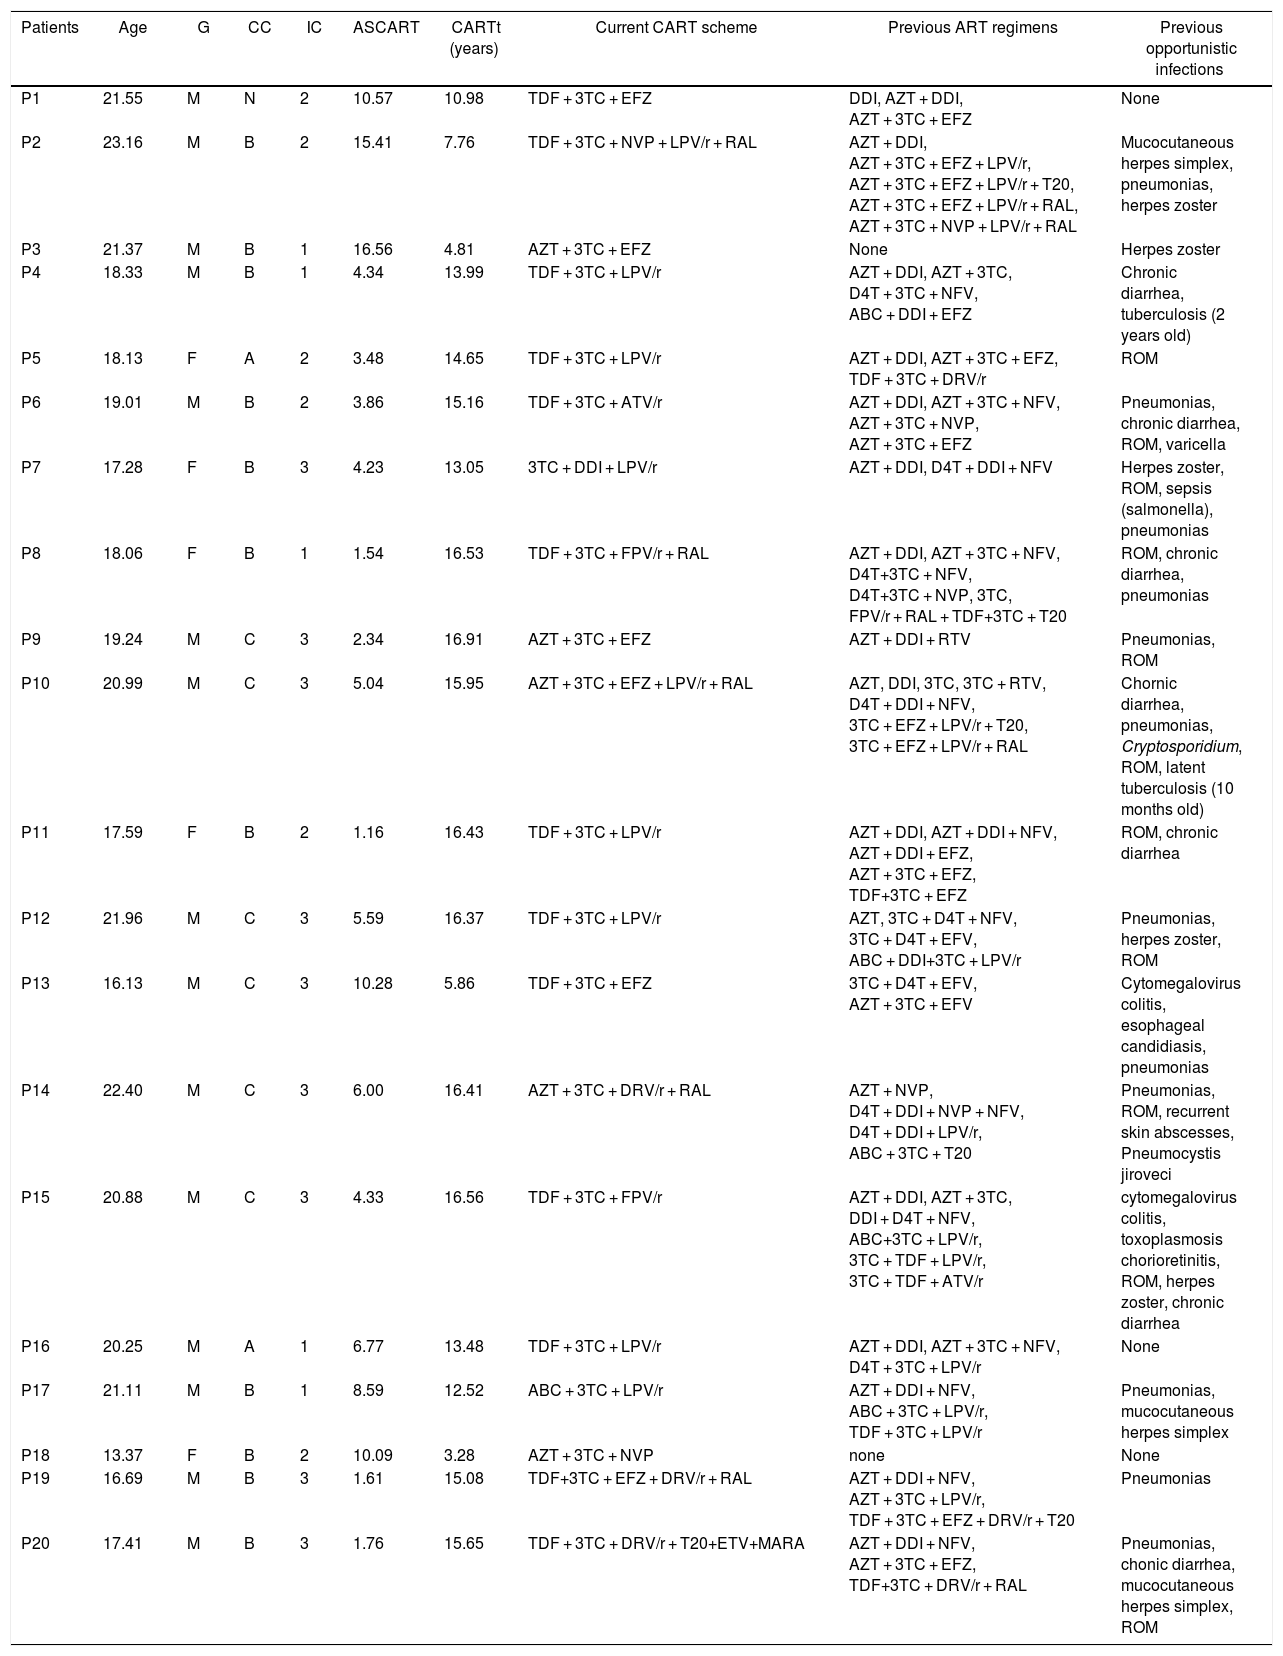
Eleven HIV-infected patients were in clinical category B, and nine were in the immunological category 3. The median age to start of cART was 4.34 (1.16–15.41) years and median cART time was 14.65 (3.28–16.91) years. Such staging characterizes patients with chronic evolution. Patient P4 had TB infection (with a positive acid-fast bacilli smear from gastric washing) at two years-old. Patient P10 presented latent TB at 10 months-old (no positive acid-fast bacilli smear from gastric washing, but a Mantoux test of 12 mm). Both individuals received appropriated treatment, and recently showed Mantoux test of 0 mm. It is noteworthy that these two patients had history of exposure or disease at a very early age, several years before this study. All of the other patients had no previous history of mycobacterial infection, which was documented by negative tuberculin tests. These data are summarized in Table 2.
Specific clinical and immunological data from the group of HIV-infected patients.
| Patients | Age | G | CC | IC | ASCART | CARTt (years) | Current CART scheme | Previous ART regimens | Previous opportunistic infections |
|---|---|---|---|---|---|---|---|---|---|
| P1 | 21.55 | M | N | 2 | 10.57 | 10.98 | TDF + 3TC + EFZ | DDI, AZT + DDI, AZT + 3TC + EFZ | None |
| P2 | 23.16 | M | B | 2 | 15.41 | 7.76 | TDF + 3TC + NVP + LPV/r + RAL | AZT + DDI, AZT + 3TC + EFZ + LPV/r, AZT + 3TC + EFZ + LPV/r + T20, AZT + 3TC + EFZ + LPV/r + RAL, AZT + 3TC + NVP + LPV/r + RAL | Mucocutaneous herpes simplex, pneumonias, herpes zoster |
| P3 | 21.37 | M | B | 1 | 16.56 | 4.81 | AZT + 3TC + EFZ | None | Herpes zoster |
| P4 | 18.33 | M | B | 1 | 4.34 | 13.99 | TDF + 3TC + LPV/r | AZT + DDI, AZT + 3TC, D4T + 3TC + NFV, ABC + DDI + EFZ | Chronic diarrhea, tuberculosis (2 years old) |
| P5 | 18.13 | F | A | 2 | 3.48 | 14.65 | TDF + 3TC + LPV/r | AZT + DDI, AZT + 3TC + EFZ, TDF + 3TC + DRV/r | ROM |
| P6 | 19.01 | M | B | 2 | 3.86 | 15.16 | TDF + 3TC + ATV/r | AZT + DDI, AZT + 3TC + NFV, AZT + 3TC + NVP, AZT + 3TC + EFZ | Pneumonias, chronic diarrhea, ROM, varicella |
| P7 | 17.28 | F | B | 3 | 4.23 | 13.05 | 3TC + DDI + LPV/r | AZT + DDI, D4T + DDI + NFV | Herpes zoster, ROM, sepsis (salmonella), pneumonias |
| P8 | 18.06 | F | B | 1 | 1.54 | 16.53 | TDF + 3TC + FPV/r + RAL | AZT + DDI, AZT + 3TC + NFV, D4T+3TC + NFV, D4T+3TC + NVP, 3TC, FPV/r + RAL + TDF+3TC + T20 | ROM, chronic diarrhea, pneumonias |
| P9 | 19.24 | M | C | 3 | 2.34 | 16.91 | AZT + 3TC + EFZ | AZT + DDI + RTV | Pneumonias, ROM |
| P10 | 20.99 | M | C | 3 | 5.04 | 15.95 | AZT + 3TC + EFZ + LPV/r + RAL | AZT, DDI, 3TC, 3TC + RTV, D4T + DDI + NFV, 3TC + EFZ + LPV/r + T20, 3TC + EFZ + LPV/r + RAL | Chornic diarrhea, pneumonias, Cryptosporidium, ROM, latent tuberculosis (10 months old) |
| P11 | 17.59 | F | B | 2 | 1.16 | 16.43 | TDF + 3TC + LPV/r | AZT + DDI, AZT + DDI + NFV, AZT + DDI + EFZ, AZT + 3TC + EFZ, TDF+3TC + EFZ | ROM, chronic diarrhea |
| P12 | 21.96 | M | C | 3 | 5.59 | 16.37 | TDF + 3TC + LPV/r | AZT, 3TC + D4T + NFV, 3TC + D4T + EFV, ABC + DDI+3TC + LPV/r | Pneumonias, herpes zoster, ROM |
| P13 | 16.13 | M | C | 3 | 10.28 | 5.86 | TDF + 3TC + EFZ | 3TC + D4T + EFV, AZT + 3TC + EFV | Cytomegalovirus colitis, esophageal candidiasis, pneumonias |
| P14 | 22.40 | M | C | 3 | 6.00 | 16.41 | AZT + 3TC + DRV/r + RAL | AZT + NVP, D4T + DDI + NVP + NFV, D4T + DDI + LPV/r, ABC + 3TC + T20 | Pneumonias, ROM, recurrent skin abscesses, Pneumocystis jiroveci |
| P15 | 20.88 | M | C | 3 | 4.33 | 16.56 | TDF + 3TC + FPV/r | AZT + DDI, AZT + 3TC, DDI + D4T + NFV, ABC+3TC + LPV/r, 3TC + TDF + LPV/r, 3TC + TDF + ATV/r | cytomegalovirus colitis, toxoplasmosis chorioretinitis, ROM, herpes zoster, chronic diarrhea |
| P16 | 20.25 | M | A | 1 | 6.77 | 13.48 | TDF + 3TC + LPV/r | AZT + DDI, AZT + 3TC + NFV, D4T + 3TC + LPV/r | None |
| P17 | 21.11 | M | B | 1 | 8.59 | 12.52 | ABC + 3TC + LPV/r | AZT + DDI + NFV, ABC + 3TC + LPV/r, TDF + 3TC + LPV/r | Pneumonias, mucocutaneous herpes simplex |
| P18 | 13.37 | F | B | 2 | 10.09 | 3.28 | AZT + 3TC + NVP | none | None |
| P19 | 16.69 | M | B | 3 | 1.61 | 15.08 | TDF+3TC + EFZ + DRV/r + RAL | AZT + DDI + NFV, AZT + 3TC + LPV/r, TDF + 3TC + EFZ + DRV/r + T20 | Pneumonias |
| P20 | 17.41 | M | B | 3 | 1.76 | 15.65 | TDF + 3TC + DRV/r + T20+ETV+MARA | AZT + DDI + NFV, AZT + 3TC + EFZ, TDF+3TC + DRV/r + RAL | Pneumonias, chonic diarrhea, mucocutaneous herpes simplex, ROM |
Abbreviation: G, gender; CC, clinical classification; IC, immune classification; ASCART, age at the start of CART; CARTt, CART time; cART, combined antiretroviral therapy; ART, antiretroviral therapy; Abbreviation — antiretrovirals: 3TC, Lamivudine; ABC, Abacavir; ATV/r, Atazanavir/ritonavir; AZT, Zidovudine; D4T, Estavudine; DDI, Didanosine; DRV/r, Darunavir/ritonavir; EFZ, Efavirenz; ETV, Etravirine; FPV/r, Fosamprenavir/ritonavir; LPV/r, Lopinavir/ritonavir; MARA, Maraviroc; NFV, Nelfinavir; NVP, Nevirapine; RAL, Raltegravir; RTV, Ritonavir; T20, Enfuvirtide; TDF, Tenofovir; Abbreviation — clinical classification: N, absent symptoms; A, mild symptoms; B, moderate symptoms; C, severe symptoms; Abbreviation — immunological classification: 1, absent immunosuppression; 2, moderate immunosuppression; 3, severe immunosuppression; Abbreviation — ROM, recurrent otitis media media.
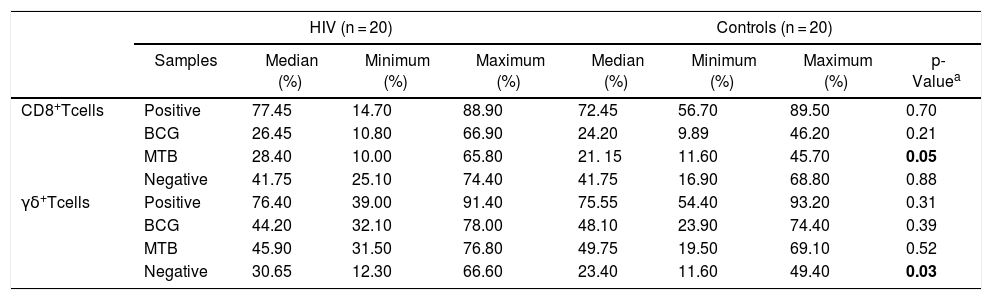
HIV-infected patients showed a significantly higher expression of HLA-DR CD8 + T-cells, either non-stimulated or cultured with MTB, when compared to healthy controls (p = 0.03 and 0.05, respectively; Table 3).
Distribution of HLA-DR+ expression (%) in CD8+ T and γδ T cells from HIV-infected patients and controls.
| HIV (n = 20) | Controls (n = 20) | |||||||
|---|---|---|---|---|---|---|---|---|
| Samples | Median (%) | Minimum (%) | Maximum (%) | Median (%) | Minimum (%) | Maximum (%) | p-Valuea | |
| CD8+Tcells | Positive | 77.45 | 14.70 | 88.90 | 72.45 | 56.70 | 89.50 | 0.70 |
| BCG | 26.45 | 10.80 | 66.90 | 24.20 | 9.89 | 46.20 | 0.21 | |
| MTB | 28.40 | 10.00 | 65.80 | 21. 15 | 11.60 | 45.70 | 0.05 | |
| Negative | 41.75 | 25.10 | 74.40 | 41.75 | 16.90 | 68.80 | 0.88 | |
| γδ+Tcells | Positive | 76.40 | 39.00 | 91.40 | 75.55 | 54.40 | 93.20 | 0.31 |
| BCG | 44.20 | 32.10 | 78.00 | 48.10 | 23.90 | 74.40 | 0.39 | |
| MTB | 45.90 | 31.50 | 76.80 | 49.75 | 19.50 | 69.10 | 0.52 | |
| Negative | 30.65 | 12.30 | 66.60 | 23.40 | 11.60 | 49.40 | 0.03 | |
Abbreviation: BCG, Bacillus–Calmette–Guérin; MTB, Mycobacterium tuberculosis.
p-values marked in bold indicate significant results.
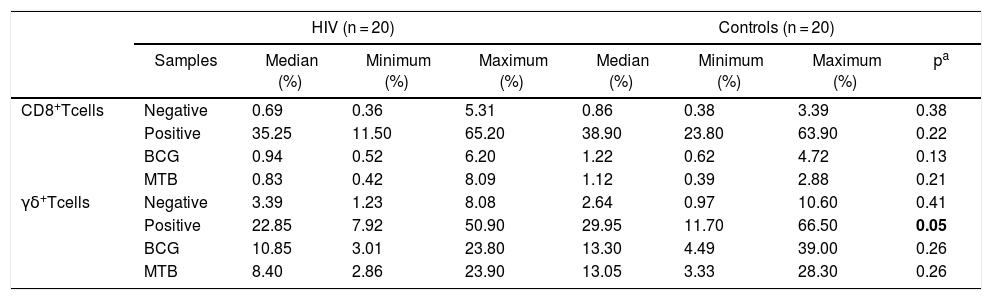
There were no significant differences between the groups in relation to degranulation of T CD8+. On the other hand, TCR-γδ cells from the HIV group showed a significantly lower expression of CD107a in response to PHA (p = 0.05; Table 4).
Distribution of CD107a expression (%) in CD8+ T and γδ T cells from HIV-infected patients and controls.
| HIV (n = 20) | Controls (n = 20) | |||||||
|---|---|---|---|---|---|---|---|---|
| Samples | Median (%) | Minimum (%) | Maximum (%) | Median (%) | Minimum (%) | Maximum (%) | pa | |
| CD8+Tcells | Negative | 0.69 | 0.36 | 5.31 | 0.86 | 0.38 | 3.39 | 0.38 |
| Positive | 35.25 | 11.50 | 65.20 | 38.90 | 23.80 | 63.90 | 0.22 | |
| BCG | 0.94 | 0.52 | 6.20 | 1.22 | 0.62 | 4.72 | 0.13 | |
| MTB | 0.83 | 0.42 | 8.09 | 1.12 | 0.39 | 2.88 | 0.21 | |
| γδ+Tcells | Negative | 3.39 | 1.23 | 8.08 | 2.64 | 0.97 | 10.60 | 0.41 |
| Positive | 22.85 | 7.92 | 50.90 | 29.95 | 11.70 | 66.50 | 0.05 | |
| BCG | 10.85 | 3.01 | 23.80 | 13.30 | 4.49 | 39.00 | 0.26 | |
| MTB | 8.40 | 2.86 | 23.90 | 13.05 | 3.33 | 28.30 | 0.26 | |
Abbreviation: BCG, Bacillus–Calmette–Guérin; MTB, Mycobacterium tuberculosis.
p-values marked in bold indicate significant results.
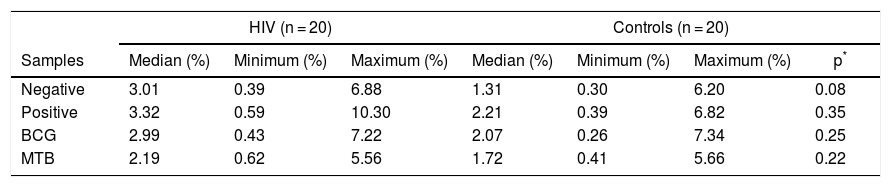
Antigen-presentation phenotype was detected in TCR-γδ T-lymphocytes, in both HIV and control groups, although without significant differences in the expression of the HLA-DR+-CD80+-CD86+ (Table 5).
Distribution of CD80+ + CD86+ expression in the populations of HLA-DR+ γδ T-lymphocytes of controls and HIV infected patients.
| HIV (n = 20) | Controls (n = 20) | ||||||
|---|---|---|---|---|---|---|---|
| Samples | Median (%) | Minimum (%) | Maximum (%) | Median (%) | Minimum (%) | Maximum (%) | p* |
| Negative | 3.01 | 0.39 | 6.88 | 1.31 | 0.30 | 6.20 | 0.08 |
| Positive | 3.32 | 0.59 | 10.30 | 2.21 | 0.39 | 6.82 | 0.35 |
| BCG | 2.99 | 0.43 | 7.22 | 2.07 | 0.26 | 7.34 | 0.25 |
| MTB | 2.19 | 0.62 | 5.56 | 1.72 | 0.41 | 5.66 | 0.22 |
Abbreviation: BCG, Bacillus–Calmette–Guérin; MTB, Mycobacterium tuberculosis.
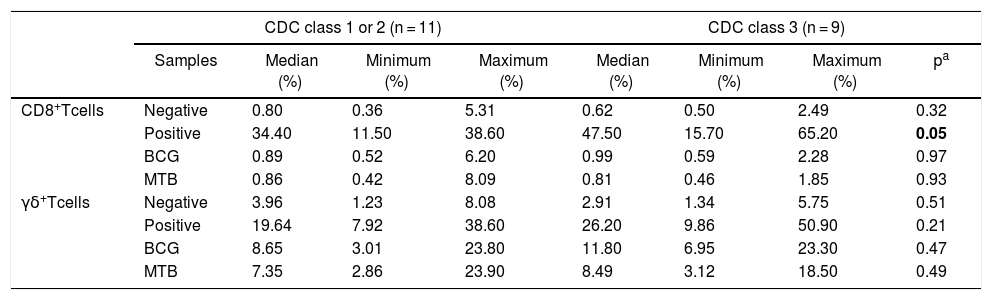
Patients within CDC immunological class 3 showed higher expression of CD107a when stimulated with PHA, in comparison to the ones in classes 1 + 2 (p = 0.05, Table 6). There were no differences between immunological classes regarding activation markers and APC phenotype.
Distribution of CD107a expression (%) in CD8+ T and γδ T cells from HIV-infected patients, separated by CDC immunological status.
| CDC class 1 or 2 (n = 11) | CDC class 3 (n = 9) | |||||||
|---|---|---|---|---|---|---|---|---|
| Samples | Median (%) | Minimum (%) | Maximum (%) | Median (%) | Minimum (%) | Maximum (%) | pa | |
| CD8+Tcells | Negative | 0.80 | 0.36 | 5.31 | 0.62 | 0.50 | 2.49 | 0.32 |
| Positive | 34.40 | 11.50 | 38.60 | 47.50 | 15.70 | 65.20 | 0.05 | |
| BCG | 0.89 | 0.52 | 6.20 | 0.99 | 0.59 | 2.28 | 0.97 | |
| MTB | 0.86 | 0.42 | 8.09 | 0.81 | 0.46 | 1.85 | 0.93 | |
| γδ+Tcells | Negative | 3.96 | 1.23 | 8.08 | 2.91 | 1.34 | 5.75 | 0.51 |
| Positive | 19.64 | 7.92 | 38.60 | 26.20 | 9.86 | 50.90 | 0.21 | |
| BCG | 8.65 | 3.01 | 23.80 | 11.80 | 6.95 | 23.30 | 0.47 | |
| MTB | 7.35 | 2.86 | 23.90 | 8.49 | 3.12 | 18.50 | 0.49 | |
Abbreviation: CDC, Centers for Disease Control and Prevention.
Abbreviation: BCG, Bacillus–Calmette–Guérin; MTB, Mycobacterium tuberculosis.
p-values marked in bold indicate significant results.
Our study showed that the overall ability to produce cytotoxic granules by CD8+ and TCR-γδ cells of vertically HIV-infected youth, under effective therapy, is comparable to that of healthy individuals in response to mycobacterial antigens, and lower, in TCR-γδ cells, in response to a mitogen. There are few reports in the literature on the production of lymphocyte granules in immunity to mycobacteria in HIV-infected patients. A study in adults coinfected with HIV and latent tuberculosis showed that CD107a expression by CD8 + T-lymphocytes was lower in HIV-infected patients than in seronegative individuals.16 In different settings, several reports have shown that production of granules after stimulation with peptides or HIV capsid proteins was reduced with the progression of infection in adults and children.17,18 In that regard, a report from a pediatric cohort demonstrated greater preservation of granule production in slow progressors.19 The production of granules for other antigens, such as those derived from Varicella-Zoster virus, has been shown to be lower in infected children than in healthy controls.20 However, the production of granules for viral capsid proteins may recover in cases of effective therapy.21,22 In relation to phosphoantigen capacity of stimulating the production of granules by TCR-γδ lymphocytes, a direct relation with the preservation of the number of CD4+ T lymphocytes was demonstrated.23 Evaluated in conjunction with the literature, our findings suggest that the production of granules can be preserved in HIV-infected individuals on effective therapy. The preservation of this important defense mechanism against mycobacteria may be relevant in the context of a chronic and lifelong infection.
Significantly lower expression of CD107a by TCR-γδ lymphocytes, in response to mitogen, observed in infected youths, may suggest that the immune recovery afforded by antiretroviral therapy is not complete. In an analogous scenario, reduced functionality and amount of TCR-γδ lymphocytes was observed in adults with chronic HIV infection.24
The higher expression of CD107a by CD8+ T-lymphocytes in the group of patients in immunological class 3 may suggest the therapeutic efficacy of cART, with immune restoration. An analogous scenario was described in reports evaluating the expression of CD107a by CD8+ and TCR-γδ cells stimulated with viral capsid proteins, with an increase in this expression associated with effective cART.21,22
In the group of HIV-infected patients, we observed increased expression of HLA-DR by non-stimulated γδ T-cells and by CD8 + T cells cultured with MTB. These results, in our view, reflect a state of inflammatory activation secondary to chronic disease, even adequately treated, in the HIV group. The importance of persistent inflammation and activation has been highlighted as one of the causes of sustained morbidity in cohorts of infected individuals with successful treatment.25
In our study, the expression of antigen presenting cell phenotype (HLA-DR+, CD80+ and CD86+) after stimulation with mycobacterial antigens, in both HIV-infected and control groups, was identified in the TCR-γδ subpopulation. This phenotype was described in professional APCs.3 Experimental data demonstrating that this subpopulation of lymphocytes would be able to perform this function has been reported.26 We did not find in the literature any study identifying this function in patients infected by HIV after stimulation with mycobacterial antigens. The relevance of this function is potentially high, considering the epidemiological importance of HIV-tuberculosis coinfection.
In conclusion, our results suggest that vertically HIV-infected youth undergoing effective treatment have preserved the production of granules by T-lymphocytes in response to mycobacterial antigens. Activation marker expression, either spontaneous or stimulated by mycobacterial antigen, was increased in the HIV-infected youth. These results underscore the importance of the careful monitoring of this population, in order to evaluate their ability to respond to mycobacteria and the inflammatory state throughout life.
FundingThis work was supported by Fundação de Amparo à Pesquisa do Estado de São Paulo (São Paulo Research Foundation) Grant number 2013-26862/9, and CAPES Foundation, Federal Government of Brazil — M.P.A. Master of Science Scholarship.
Conflicts of interestThe authors declare no conflicts of interest.
We would like to acknowledge the generous contribution of all the patients and healthy controls who agreed in participating in this project. We also would like to thank the nursing staff at the Pediatric Immunodeficiency Outpatient Unit, for helping in blood collection.
