Antiretroviral therapy (ART) saved millions from HIV-1 infection and AIDS, but some patients do not experience adequate CD4+ T cells gain despite achieving viral suppression. The genetic component of this condition is not yet completely elucidated.
ObjectiveTo identify predictive genetic markers of immune response to ART.
MethodsCase–control study. Out of 176 HIV-infected patients recruited in the city of Recife, Northeast Brazil, 67 patients with no immunologic response were the cases and the remaining 109 patients who responded were the controls. A set of 94 selected single nucleotide polymorphisms (SNPs) involved in antiretroviral drugs pharmacodynamic pathways and immune system homeostasis were genotyped, while the remaining 48 were ancestry informative markers (AIMs) for controlling for eventual hidden population structure.
ResultsMale patients were overrepresented in non-responder group (p=0.01). Non-responders also started with lower absolute CD4+ T cell counts (p<0.001). We found five SNPs significantly associated with the outcome, being three more frequent in non-responders than responders: rs2243250 (IL4) A allele (p=0.04), rs1128503 (ABCB1) A allele (p=0.03) and rs707265 (CYP2B6) A allele (p=0.02), whereas the other two were less frequent in non-responders: rs2069762 (IL2) C allele (p=0.004) and rs4646437 (CYP3A4) A allele (p=0.04).
ConclusionSome significant univariate associations remained independently associated at multivariate survival analysis modeling, such as pre-treatment CD4+ T cells counts, IL2 and ABCB1 genotypes, and use of protease inhibitors, yielding a predictive model for the probability for immune response. More studies are needed to unravel the genetic basis of ART immunological non-response.
The introduction of antiretroviral therapy (ART) in the clinical practice saved millions of lives from acquired immunodeficiency syndrome (AIDS) related deaths, which is the result of chronic infection by the human immunodeficiency virus type 1 (HIV-1).1,2 ART regimens are combinations of three drugs. For several years, the first-line regimens usually included two nucleoside analog reverse transcriptase inhibitors (NRTIs) and a non-nucleoside reverse transcriptase inhibitor (NNRTI) or a protease inhibitor (PI). Currently, integrase inhibitors (INI) are being recommended instead of NNRTI or PI, with the objective of suppressing viral replication.3,4
With viral suppression, replenishment of lost CD4+ T cells typically happens in a biphasic manner: a rapid proliferation during the first three to six months of ART, caused by memory T cells redistribution, followed by a slower proliferation phase by naïve T cells production by the thymus.5 However, some patients do not present optimal CD4+ T cells gains, even with persistent viral suppression. This phenomenon is named immunological failure or immunological non-response, and it is associated with higher risk of non-AIDS cardiovascular disease, liver and kidney disorders, in addition to early aging.6–9
The immunological non-response has not yet been completely elucidated. Older age, male sex, advanced HIV-1 infection at treatment start and coinfections by other viruses are some known risk factors,5,10,11 but the influence of host genetic component is still debated. Promising genetic candidates include genes involved in antiretroviral drugs pharmacodynamic pathways12,13 and genes involved in immune functions (inflammation, apoptosis) and homeostasis, such as the interleukins IL2, IL7 and IL15, which coordinate T cell proliferation.14
Our hypothesis was that genetic variation in these genes would affect the distribution of antiretroviral drugs, possibly favoring residual (undetected) virus replication, which in turn would drive immune activation and immune cell death, hampering CD4+ T cell recovery. Simultaneously, single nucleotide polymorphisms (SNPs) in the immune system genes would favor this increased cell activation, increased apoptosis or decreased cell proliferation, leading to suboptimal immunological response to ART. So, we aimed at identifying genetic variants associated with delayed CD4+ T cell counts recovery to quasi-normal or normal levels.
Material and methodsSubjectsA total of 176 (91 females, 51.7% and 85 males, 48.3%) HIV-1 infected patients receiving care at Instituto de Medicina Integral Professor Fernando Figueira (IMIP) were recruited in Recife and nearby cities, Pernambuco state, Northeast Brazil, for a case–control, observational study between 2011 and 2015.
Inclusion criteria were: age over 18 years old, not reporting illicit drug use, and not being pregnant. Informed consent to participate in the study and to have the medical charts reviewed was obtained from all included participants. A peripheral blood sample was collected from each patient. IMIP Research Ethics Committee approved the study protocol (number 3629-13).
Each patient answered a standard questionnaire about sex, age and age at ART start, socioeconomic status, smoking, and drinking habits. The data extracted from medical charts covered the whole period between the first and last plasma viral load (pVL) and CD4+ T cell absolute counts and percentage (relative to all white blood cells) measurements (retrospective follow-up).
Other abstracted data included ART regimens received and their refill prescriptions and serological status for the following etiologic agents: HBV, HCV, CMV (IgG and IgM), HTLV-1/2, Toxoplasma gondii (IgG and IgM) and Treponema pallidum (VDRL) and occasional AIDS-defining conditions following the Centers for Disease Control (CDC) 1993 Revised Classification System.15
Patient classificationAll patients achieved persistent viral suppression, which was defined as maintaining undetectable (also known as “target not detected”) plasma viral load measurements (pVL<50copies/mL as measured by RT-PCR). Current pVL quantification methods adopted in Brazil, such as Abbott RealTime HIV-1 Viral Load Assay16 have detection limits of 40copies/mL, but since our sample is retrospective, we adopted the 50copies threshold to account for measurements using earlier methods. No patient presented viral load rebound, which was defined as two consecutive pVL>1000copies/mL at any time after initial suppression, according to Brazil's Ministry of Health's guidelines at the time of patients’ recruitment.17 In the study setting, pVL measurements, CD4+ T cell counts and other laboratory tests were generally performed every three or four months, at the physician's discretion.
Immunologic response was defined as CD4+ T cell percentage achieving 30% or higher for two consecutive measurements during follow-up and immunological non-response if otherwise, following Brazilian Ministry of Health's guidelines.17 If a patient already had pre-ART CD4+ T cell percentages >30% (early start patients), immunological response was considered as an absolute gain of 200cells/μL, according to a previous study.5 CD4+ T cell percentages were preferred instead of absolute counts because percentages are less variable over time.18
Thus, 67 patients were categorized into immunological non-response and 109 into immunological response groups and their follow-up duration was recorded for further survival analysis.
SNPs selection and genotypingGenes and SNPs were selected through literature search and functional criteria. We selected 46 SNPs distributed in 19 genes of antiretroviral pharmacodynamic pathways: ABCB1 (rs1128503, rs2214102, rs2235048 and rs3842), ABCC1 (rs129081, rs113264879, rs4148380, rs8056298, rs212091 and rs16967632), ABCG2 (rs115770495, rs1448784 and rs2231142), CYP1A2 (rs762551), CYP2A6 (rs8192726), CYP2B6 (rs8192709, rs28399499, rs34097093, rs28399502, rs707265 and rs1042389), CYP3A4 (rs4646437), SLC22A6 (rs11568629, rs11568628 and rs4149170) and NR1I3 (rs3003596)19–27 and immunological activation and homeostasis: CCL5 (rs2107538), FAS (rs2234767 and rs1800682), IFNG (rs2069709), IL10 (rs2222202, rs1800871 and rs1800890), IL10RA (rs3135932 and rs9610), IL15 (rs10519613 and rs10833), IL1B (rs16944), IL2 (rs2069762), IL4 (rs2243250), IL7R (rs1494555, rs11567762, rs6897932, rs3822731, rs987106 and rs3194051).28–30
Additionally, 48 SNPs that served as ancestry informative markers (AIMs) were also genotyped (all variants are listed on Supplementary Table 1). Briefly, these SNPs help estimating ancestry proportions in admixed populations such as the one enrolled in our study, controlling for population structure and reducing bias during genetic association analysis.31 Genomic DNA was extracted through Promega® Wizard Genomic DNA Purification Kit (Fitchburg, Wisconsin, USA), following manufacturer's instructions. Genotyping was performed through VeraCode® platform of GoldenGate® Illumina Inc (San Diego, California, USA) technology, following manufacturer's instructions.
Raw genotyping data were extracted with Illumina® Genome Studio 2.0 software and exported to an Excel® worksheet. After processing, the dataset was exported into PLINK software, version 1.9032 to perform quality control (QC) filtering. Samples and variants with less than 90% global call rates were removed from further analysis. Variants with significant departure from Hardy–Weinberg equilibrium were also removed, using an exact test with p-value<0.001 as threshold.
Ancestry proportion estimationWe used ADMIXTURE software33 to carry out a “supervised analysis” allowing estimation of ancestry proportions in our admixed samples, using 2000 bootstrap steps with the AIMs panel mentioned above. The calculations were made assuming three different ancestral populations (K=3; African, Amerindian, and European).
Statistical analysisComparisons between immune non-response and immune response groups were performed through Fisher's exact test or Chi-square test for categorical variables (sex, ART regimens, genetic association tests) and Mann–Whitney test for continuous variables (age and pre-ART CD4+ T cell absolute counts). Age at ART start was also treated as a categorical variable with four strata: 18–29 years, 29–39 years, 39–49 years, and 49 years or more.
Additionally, univariate survival analyses were performed through Kaplan–Meier survival probability estimator having time to immune response as the dependent variable. Estimators for each variable were then compared through Cox–Mantel log rank test to assess if they exerted statistically significant influence on the dependent variable.
Alleles and genotypes counts and frequencies were obtained through direct counting. Compliance to Hardy–Weinberg equilibrium was also assessed through Chi-square test. All tests were two-sided. The variables (with the exception of coinfections serological status, smoking and drinking habits – data not shown here- for the last two – and AIDS-defining conditions were not included in further analyses due to high prevalence of missing data – over 10% of data points, to avoid the introduction of bias into the model) were included in a multivariate survival analysis Cox proportional hazards model to assess which variables would independently influence immune response. All analyses were performed with R software, version 3.3.1.34
ResultsPatients’ characteristicsThe individuals in our sample presented a major European ancestry contribution (mean proportion 55.2±18.5%), followed by African (32.3±16.4%) and Amerindian (12.4±10.5%), as expected, due to our previous works with other samples of the same general population.31
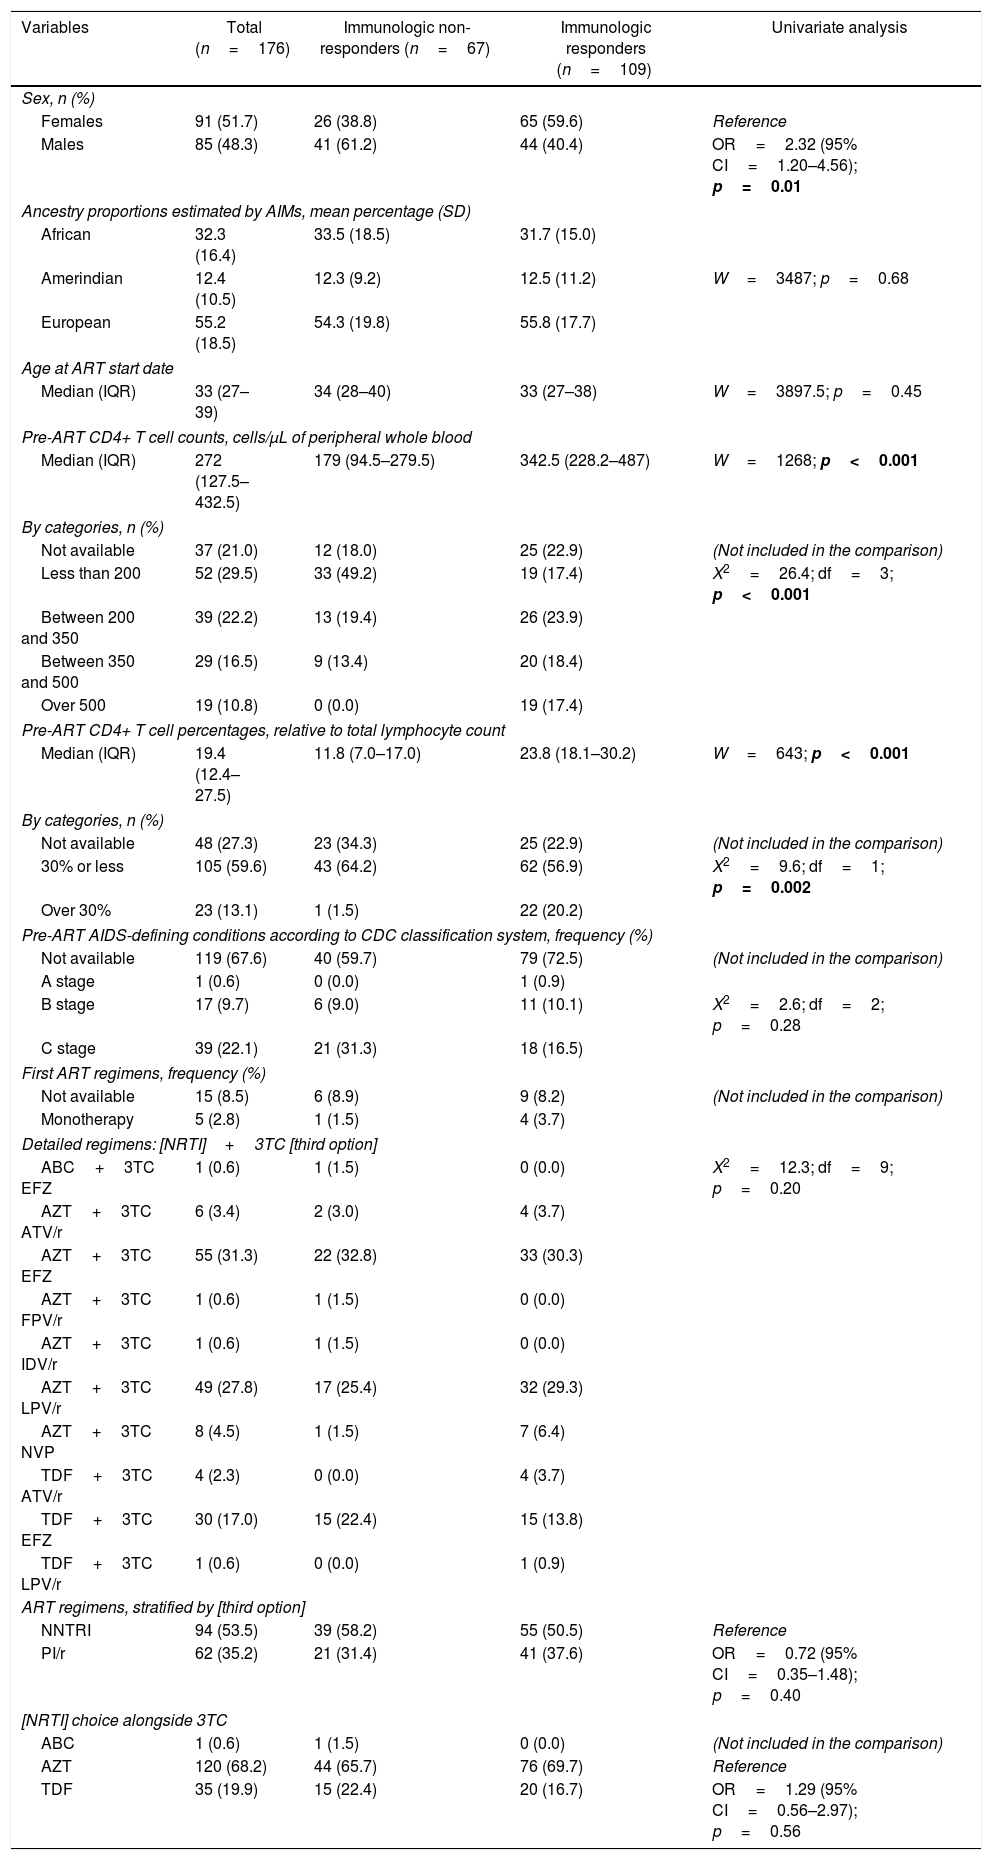
The median age at treatment start was 33 years old (interquartile range, IQR=27–39), and the patients tended to start ART with relatively low CD4+ T cell counts/μL of peripheral whole blood (median=272, IQR=127.5–432.5), and 29.5% of the patients started with less than 200cells/μL. In contrast, only 10.8% of the patients started with more than 500cells/μL. Similarly, CD4 percentages relative to total lymphocyte count were also low, (median=19.4%, IQR=12.4–27.5%), and only 13.1% of the patients started therapy with more than 30% CD4+ T cells. Most AIDS-defining conditions diagnoses were not available (67.6%) in the medical charts, but at least 22.1% of the patients started ART with C stage conditions.
Regarding ART regimens, the majority of the patients received zidovudine+lamivudine (AZT+3TC) as first line NRTI backbone following the guidelines at that moment (68.2%), followed by tenofovir+lamivudine (TDF+3TC, 19.9%) and abacavir+lamivudine (ABC+3TC, 0.6%). AZT monotherapy was the starting treatment for 2.8% of the patients, and information on the first regimen received was not available for 8.5% of the patients. The third drug option was mostly a NNRTI (53.5%), such as efavirenz (EFZ) or nevirapine (NVP), and ritonavir boosted PI such as lopinavir or atazanavir (LPV/r or ATV/r) prescribed to 35.2% of the patients. Table 1 also displays univariate comparison of patients’ characteristics.
Pre-treatment characteristics of study subjects according to antiretroviral therapy immunologic response.
| Variables | Total (n=176) | Immunologic non-responders (n=67) | Immunologic responders (n=109) | Univariate analysis |
|---|---|---|---|---|
| Sex, n (%) | ||||
| Females | 91 (51.7) | 26 (38.8) | 65 (59.6) | Reference |
| Males | 85 (48.3) | 41 (61.2) | 44 (40.4) | OR=2.32 (95% CI=1.20–4.56); p=0.01 |
| Ancestry proportions estimated by AIMs, mean percentage (SD) | ||||
| African | 32.3 (16.4) | 33.5 (18.5) | 31.7 (15.0) | |
| Amerindian | 12.4 (10.5) | 12.3 (9.2) | 12.5 (11.2) | W=3487; p=0.68 |
| European | 55.2 (18.5) | 54.3 (19.8) | 55.8 (17.7) | |
| Age at ART start date | ||||
| Median (IQR) | 33 (27–39) | 34 (28–40) | 33 (27–38) | W=3897.5; p=0.45 |
| Pre-ART CD4+ T cell counts, cells/μL of peripheral whole blood | ||||
| Median (IQR) | 272 (127.5–432.5) | 179 (94.5–279.5) | 342.5 (228.2–487) | W=1268; p<0.001 |
| By categories, n (%) | ||||
| Not available | 37 (21.0) | 12 (18.0) | 25 (22.9) | (Not included in the comparison) |
| Less than 200 | 52 (29.5) | 33 (49.2) | 19 (17.4) | X2=26.4; df=3; p<0.001 |
| Between 200 and 350 | 39 (22.2) | 13 (19.4) | 26 (23.9) | |
| Between 350 and 500 | 29 (16.5) | 9 (13.4) | 20 (18.4) | |
| Over 500 | 19 (10.8) | 0 (0.0) | 19 (17.4) | |
| Pre-ART CD4+ T cell percentages, relative to total lymphocyte count | ||||
| Median (IQR) | 19.4 (12.4–27.5) | 11.8 (7.0–17.0) | 23.8 (18.1–30.2) | W=643; p<0.001 |
| By categories, n (%) | ||||
| Not available | 48 (27.3) | 23 (34.3) | 25 (22.9) | (Not included in the comparison) |
| 30% or less | 105 (59.6) | 43 (64.2) | 62 (56.9) | X2=9.6; df=1; p=0.002 |
| Over 30% | 23 (13.1) | 1 (1.5) | 22 (20.2) | |
| Pre-ART AIDS-defining conditions according to CDC classification system, frequency (%) | ||||
| Not available | 119 (67.6) | 40 (59.7) | 79 (72.5) | (Not included in the comparison) |
| A stage | 1 (0.6) | 0 (0.0) | 1 (0.9) | |
| B stage | 17 (9.7) | 6 (9.0) | 11 (10.1) | X2=2.6; df=2; p=0.28 |
| C stage | 39 (22.1) | 21 (31.3) | 18 (16.5) | |
| First ART regimens, frequency (%) | ||||
| Not available | 15 (8.5) | 6 (8.9) | 9 (8.2) | (Not included in the comparison) |
| Monotherapy | 5 (2.8) | 1 (1.5) | 4 (3.7) | |
| Detailed regimens: [NRTI]+3TC [third option] | ||||
| ABC+3TC EFZ | 1 (0.6) | 1 (1.5) | 0 (0.0) | X2=12.3; df=9; p=0.20 |
| AZT+3TC ATV/r | 6 (3.4) | 2 (3.0) | 4 (3.7) | |
| AZT+3TC EFZ | 55 (31.3) | 22 (32.8) | 33 (30.3) | |
| AZT+3TC FPV/r | 1 (0.6) | 1 (1.5) | 0 (0.0) | |
| AZT+3TC IDV/r | 1 (0.6) | 1 (1.5) | 0 (0.0) | |
| AZT+3TC LPV/r | 49 (27.8) | 17 (25.4) | 32 (29.3) | |
| AZT+3TC NVP | 8 (4.5) | 1 (1.5) | 7 (6.4) | |
| TDF+3TC ATV/r | 4 (2.3) | 0 (0.0) | 4 (3.7) | |
| TDF+3TC EFZ | 30 (17.0) | 15 (22.4) | 15 (13.8) | |
| TDF+3TC LPV/r | 1 (0.6) | 0 (0.0) | 1 (0.9) | |
| ART regimens, stratified by [third option] | ||||
| NNTRI | 94 (53.5) | 39 (58.2) | 55 (50.5) | Reference |
| PI/r | 62 (35.2) | 21 (31.4) | 41 (37.6) | OR=0.72 (95% CI=0.35–1.48); p=0.40 |
| [NRTI] choice alongside 3TC | ||||
| ABC | 1 (0.6) | 1 (1.5) | 0 (0.0) | (Not included in the comparison) |
| AZT | 120 (68.2) | 44 (65.7) | 76 (69.7) | Reference |
| TDF | 35 (19.9) | 15 (22.4) | 20 (16.7) | OR=1.29 (95% CI=0.56–2.97); p=0.56 |
Bold values were statistically significant values, p<0.05.
3TC, lamivudine; 95% CI, 95% confidence interval; ABC, abacavir; AIDS, acquired immunodeficiency syndrome; ART, antiretroviral therapy; ATV/r, ritonavir-boosted atazanavir; CDC, Center for Disease Control (USA); df, degrees of freedom; EFZ, efavirenz; FPV/r, ritonavir-boosted fosamprenavir; IDV/r, ritonavir-boosted indinavir; IQR, interquartile range; LPV/r, ritonavir-boosted lopinavir; NNRTI, non-nucleoside analog reverse transcriptase inhibitor; NRTI, nucleoside analog reverse transcriptase inhibitor; NVP, nevirapine; OR, odds ratio; p, p-value; PI, protease inhibitor; SD, standard deviation; TDF, tenofovir; W, Mann–Whitney test statistic; X2, chi-squared test statistic.
Males had more than two-fold increased risk of presenting immunological non-response (61.2% non-responders and 40.4% responders; odds ratio (OR)=2.32; 95% CI=1.20–4.56; p=0.01). Both groups had similar ages at treatment start (median 34 years and 33 years, respectively; p=0.45). As expected, non-responders started treatment with lower absolute CD4+ T cell count than responders (median 179cells/μL vs. 342.5cells/μL, respectively, p<0.001), and most non-responders started therapy with less than 200cells/μL (49.2% vs. 17.4%; p<0.001). Patients in both groups had similar ancestry backgrounds (mean African ancestry proportion 33.5% in non-responders vs. 31.7% in responders, p=0.68).
Non-responders started treatment with more advanced disease than responders; 31.3% of non-responders presented C (AIDS-indicator conditions) CDC system stage vs. 16.5% of responders, although the difference did not reach statistical significance (p=0.28).
Patients started with similar first-line ART regimens (p=0.20). There was neither difference in the frequency of NNRTI and PI (p=0.40) as third drug nor AZT+3TC and TDF+3TC (p=0.56) as backbones.
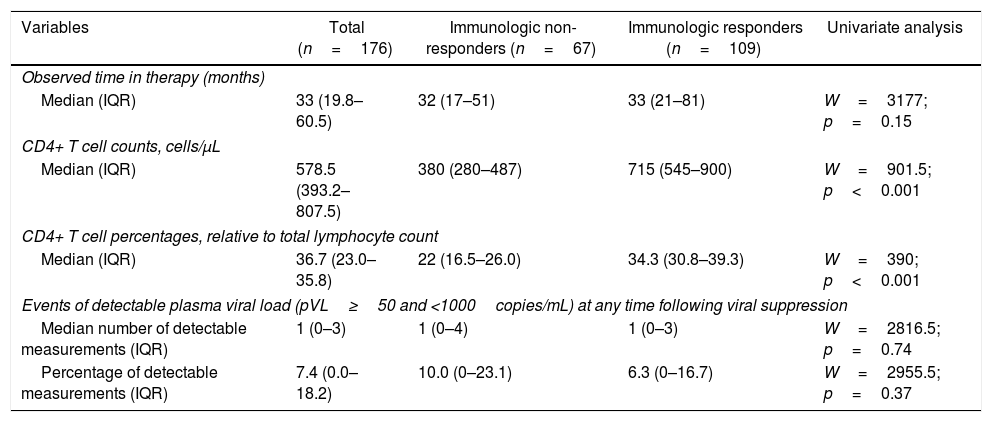
The median time on treatment and of laboratory tests was 33 months (IQR=19.8–60.5). As expected, ART greatly benefited patients. Aggregating laboratory measurements from the last observation in each patient, the median CD4+ T cell count rose to 578.5cells//μL of blood (IQR=393.2–807.5), an increment by nearly 113% from pre-ART values mentioned above (p<0.001). Similarly, CD4+ T cell percentages rose to 36.7% (IQR=23.0–35.8), an increment by nearly 62% (p<0.001). These post-ART changes are summarized in Table 2.
Post-treatment immunologic response with corresponding observable follow-up time on therapy according to study groups.
| Variables | Total (n=176) | Immunologic non-responders (n=67) | Immunologic responders (n=109) | Univariate analysis |
|---|---|---|---|---|
| Observed time in therapy (months) | ||||
| Median (IQR) | 33 (19.8–60.5) | 32 (17–51) | 33 (21–81) | W=3177; p=0.15 |
| CD4+ T cell counts, cells/μL | ||||
| Median (IQR) | 578.5 (393.2–807.5) | 380 (280–487) | 715 (545–900) | W=901.5; p<0.001 |
| CD4+ T cell percentages, relative to total lymphocyte count | ||||
| Median (IQR) | 36.7 (23.0–35.8) | 22 (16.5–26.0) | 34.3 (30.8–39.3) | W=390; p<0.001 |
| Events of detectable plasma viral load (pVL≥50 and <1000copies/mL) at any time following viral suppression | ||||
| Median number of detectable measurements (IQR) | 1 (0–3) | 1 (0–4) | 1 (0–3) | W=2816.5; p=0.74 |
| Percentage of detectable measurements (IQR) | 7.4 (0.0–18.2) | 10.0 (0–23.1) | 6.3 (0–16.7) | W=2955.5; p=0.37 |
IQR, interquartile range; p, p-value; W, Mann–Whitney test statistic.
The median time to achieve immunologic response was 47 months (95% CI=36–64). The time for men and women to achieve immunologic response was almost the same with a median time of 48 months (95% CI=36–110) for men and 46 months (95% CI=30–66) for women (p=0.42). Age groups at ART start was neither associated with time until immunologic response (p=0.67). Similarly, use of AZT instead of TDF (p=0.11) or PIs instead of NNRTIs as third drug (p=0.14) on ART regimens also did not influence time until response.
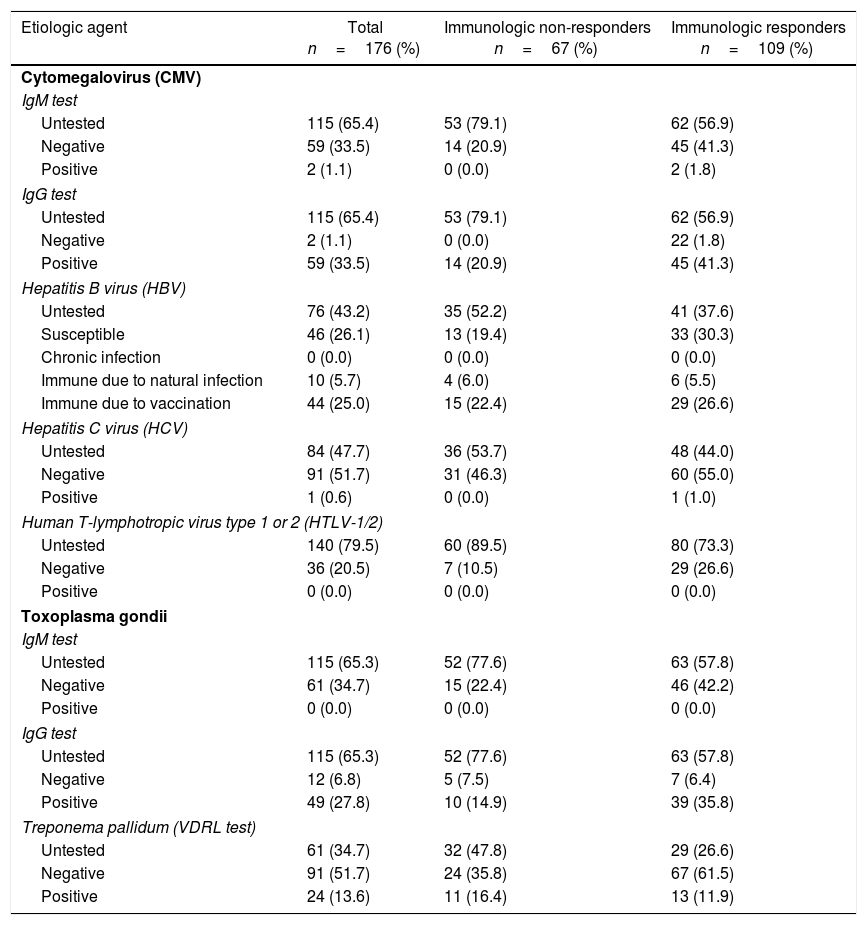
Serological tests results were not recorded in medical charts of the majority of patients. Although about 65% of the patients did not results for CMV and toxoplasmosis infections, the prevalence of positive IgG was 33.5% for CMV and 27.8% for toxoplasmosis. Syphilis VDRL positivity rate was 13.6% of the total (34.7% untested); 25.0% were immune to hepatitis B virus (HBV) due to vaccination, 5.7% due to natural infection, and the remaining 26.1% were susceptible, but none presented chronic infection (43.2% untested). No patient was positive for anti-HTLV-1/2 (79.5% untested); a single case of anti-HCV positive was detected (47.7% untested). Table 3 details the serological tests results.
Coinfections serological status of study subjects according to antiretroviral therapy immunologic response.
| Etiologic agent | Total n=176 (%) | Immunologic non-responders n=67 (%) | Immunologic responders n=109 (%) |
|---|---|---|---|
| Cytomegalovirus (CMV) | |||
| IgM test | |||
| Untested | 115 (65.4) | 53 (79.1) | 62 (56.9) |
| Negative | 59 (33.5) | 14 (20.9) | 45 (41.3) |
| Positive | 2 (1.1) | 0 (0.0) | 2 (1.8) |
| IgG test | |||
| Untested | 115 (65.4) | 53 (79.1) | 62 (56.9) |
| Negative | 2 (1.1) | 0 (0.0) | 22 (1.8) |
| Positive | 59 (33.5) | 14 (20.9) | 45 (41.3) |
| Hepatitis B virus (HBV) | |||
| Untested | 76 (43.2) | 35 (52.2) | 41 (37.6) |
| Susceptible | 46 (26.1) | 13 (19.4) | 33 (30.3) |
| Chronic infection | 0 (0.0) | 0 (0.0) | 0 (0.0) |
| Immune due to natural infection | 10 (5.7) | 4 (6.0) | 6 (5.5) |
| Immune due to vaccination | 44 (25.0) | 15 (22.4) | 29 (26.6) |
| Hepatitis C virus (HCV) | |||
| Untested | 84 (47.7) | 36 (53.7) | 48 (44.0) |
| Negative | 91 (51.7) | 31 (46.3) | 60 (55.0) |
| Positive | 1 (0.6) | 0 (0.0) | 1 (1.0) |
| Human T-lymphotropic virus type 1 or 2 (HTLV-1/2) | |||
| Untested | 140 (79.5) | 60 (89.5) | 80 (73.3) |
| Negative | 36 (20.5) | 7 (10.5) | 29 (26.6) |
| Positive | 0 (0.0) | 0 (0.0) | 0 (0.0) |
| Toxoplasma gondii | |||
| IgM test | |||
| Untested | 115 (65.3) | 52 (77.6) | 63 (57.8) |
| Negative | 61 (34.7) | 15 (22.4) | 46 (42.2) |
| Positive | 0 (0.0) | 0 (0.0) | 0 (0.0) |
| IgG test | |||
| Untested | 115 (65.3) | 52 (77.6) | 63 (57.8) |
| Negative | 12 (6.8) | 5 (7.5) | 7 (6.4) |
| Positive | 49 (27.8) | 10 (14.9) | 39 (35.8) |
| Treponema pallidum (VDRL test) | |||
| Untested | 61 (34.7) | 32 (47.8) | 29 (26.6) |
| Negative | 91 (51.7) | 24 (35.8) | 67 (61.5) |
| Positive | 24 (13.6) | 11 (16.4) | 13 (11.9) |
IgM, immunoglobulin M; IgG, immunoglobulin G.
Two candidate SNPs, rs11568629 (SLC22A6) and rs16967632 (ABCC1) and four AIMs did not pass genotyping QC and were removed from further analysis. Other variant, rs34097093 (CYP2B6), was also removed because all individuals in the sample had the same genotype (one of the alleles was fixed). The remaining allele and genotype frequencies were all in conformity to Hardy–Weinberg equilibrium according to PLINK software exact test. All frequencies and global call rates are displayed in Supplementary Table 2. Therefore, further analyses were performed using the remaining 43 candidate SNPs and 44 AIMs.
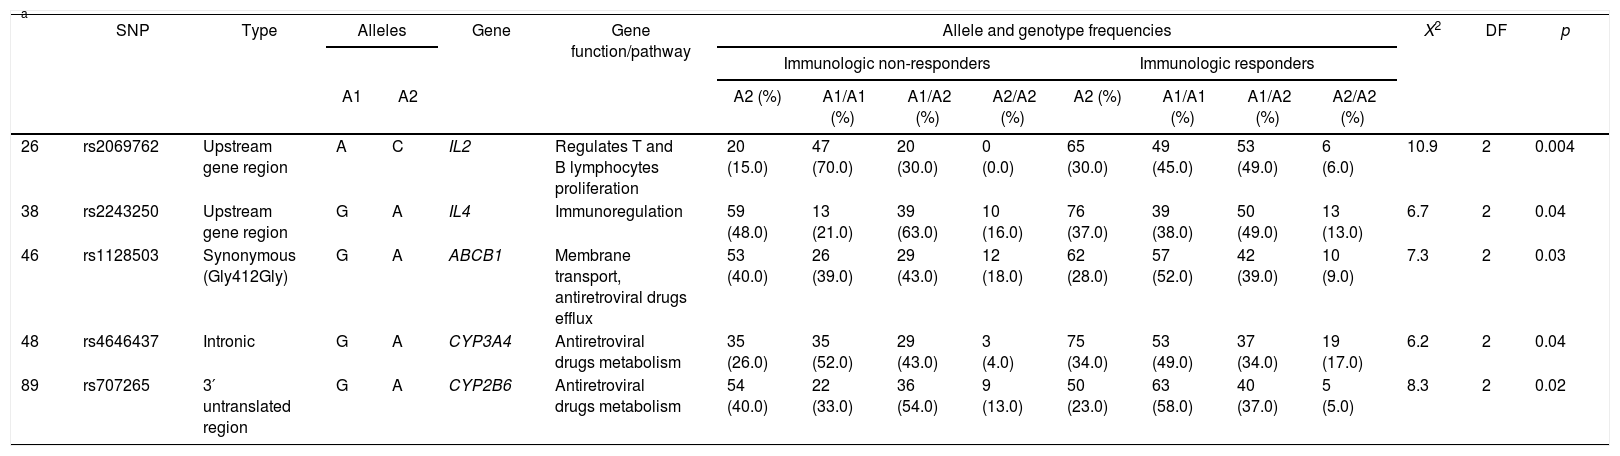
Five SNPs presented statistic association with immunological outcome. Three minor alleles were more frequent in non-responders than responders: rs2243250 (IL4) A allele (48.0% vs. 37.0%, p=0.04), rs1128503 (ABCB1) A allele (40.0% vs. 28.0%, p=0.03) and rs707265 (CYP2B6) A allele (40.0% vs. 23.0%, p=0.02), whereas the other two were more frequent in responders: rs2069762 (IL2) C allele (15.0% vs. 30.0%; p=0.004) and rs4646437 (CYP3A4) A allele (26.0% vs. 34.0%; p=0.04). Allele, genotype frequencies and statistical analyses for these five SNPs are displayed in Table 4 and Supplementary Table 3 displays all genetic association results.
Allele and genotype frequencies of variants showing statistically significant genetic association with immunologic outcome.
| a | SNP | Type | Alleles | Gene | Gene function/pathway | Allele and genotype frequencies | X2 | DF | p | ||||||||
|---|---|---|---|---|---|---|---|---|---|---|---|---|---|---|---|---|---|
| Immunologic non-responders | Immunologic responders | ||||||||||||||||
| A1 | A2 | A2 (%) | A1/A1 (%) | A1/A2 (%) | A2/A2 (%) | A2 (%) | A1/A1 (%) | A1/A2 (%) | A2/A2 (%) | ||||||||
| 26 | rs2069762 | Upstream gene region | A | C | IL2 | Regulates T and B lymphocytes proliferation | 20 (15.0) | 47 (70.0) | 20 (30.0) | 0 (0.0) | 65 (30.0) | 49 (45.0) | 53 (49.0) | 6 (6.0) | 10.9 | 2 | 0.004 |
| 38 | rs2243250 | Upstream gene region | G | A | IL4 | Immunoregulation | 59 (48.0) | 13 (21.0) | 39 (63.0) | 10 (16.0) | 76 (37.0) | 39 (38.0) | 50 (49.0) | 13 (13.0) | 6.7 | 2 | 0.04 |
| 46 | rs1128503 | Synonymous (Gly412Gly) | G | A | ABCB1 | Membrane transport, antiretroviral drugs efflux | 53 (40.0) | 26 (39.0) | 29 (43.0) | 12 (18.0) | 62 (28.0) | 57 (52.0) | 42 (39.0) | 10 (9.0) | 7.3 | 2 | 0.03 |
| 48 | rs4646437 | Intronic | G | A | CYP3A4 | Antiretroviral drugs metabolism | 35 (26.0) | 35 (52.0) | 29 (43.0) | 3 (4.0) | 75 (34.0) | 53 (49.0) | 37 (34.0) | 19 (17.0) | 6.2 | 2 | 0.04 |
| 89 | rs707265 | 3′ untranslated region | G | A | CYP2B6 | Antiretroviral drugs metabolism | 54 (40.0) | 22 (33.0) | 36 (54.0) | 9 (13.0) | 50 (23.0) | 63 (58.0) | 40 (37.0) | 5 (5.0) | 8.3 | 2 | 0.02 |
Since non-responders and responders had similar ancestry proportions (for example, mean African contribution 33.5±18.5% vs. 31.7±15.0%, respectively; p=0.68), we believe that there is no hidden genetic structure biasing the genetic association analysis. As mentioned in the next session, individual African genetic ancestry contributions were included in the multivariate Cox proportional hazards model for an additional “genomic control”.35
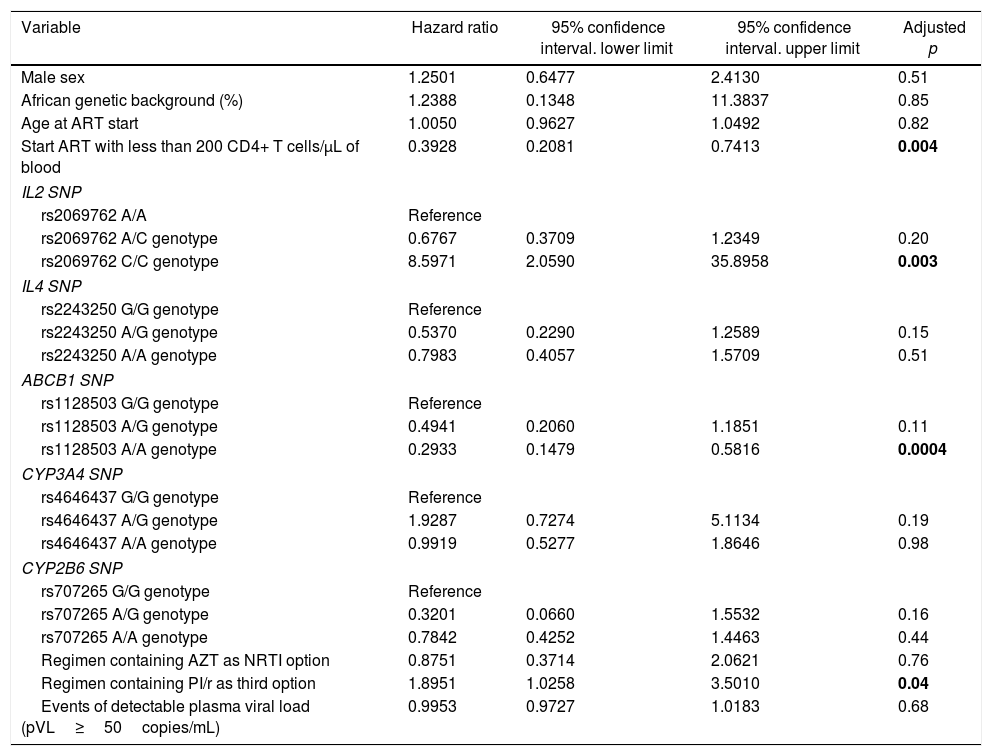
Multivariate analysisThe multivariate Cox proportional hazards analysis suggested that starting ART with less than 200 CD4+ T cells/μL, IL2 rs2069762 genotypes, ABCB1 rs1128503 genotypes and PI/r use were significantly associated with time to immune response.
Individuals starting ART with less than 200 CD4+ T cells/μL had 61% lower chance of achieving immunologic response when compared with those who started ART with more than 200 CD4+ T cells/μL (HR=0.39, 95% CI=0.21–0.74, adjusted p=0.004). IL2 rs2069762 C/C genotype had an eight-fold higher probability of achieving immunologic response when compared to A/A genotype (HR=8.60, 95% CI=2.06–35.89, adjusted p=0.003) during the follow-up period. ABCB1 rs1128503 A/A genotype was associated with 71% lower chance of achieving immunologic response when compared with G/G genotype (HR=0.29, 95% CI=0.15–0.58, adjusted p=0.0004). Using an ART regimen containing PI/r had almost two-fold higher probability of achieving immunologic response (HR=1.89, 95% CI=1.03–3.50, adjusted p=0.04).
On the other hand, sex (adjusted p=0.51), genetic background (adjusted p=0.85), age at treatment start (adjusted p=0.82), IL4 rs2243250, CYP3A4 and CYP2B6 SNPs, use of AZT as NRTI backbone, and events of detectable pVL following viral suppression were not significantly associated with probability to immune response on multivariate analysis. The multivariate analysis results are summarized in Table 5.
Cox proportional hazards multivariate model for predicting time to immune response.
| Variable | Hazard ratio | 95% confidence interval. lower limit | 95% confidence interval. upper limit | Adjusted p |
|---|---|---|---|---|
| Male sex | 1.2501 | 0.6477 | 2.4130 | 0.51 |
| African genetic background (%) | 1.2388 | 0.1348 | 11.3837 | 0.85 |
| Age at ART start | 1.0050 | 0.9627 | 1.0492 | 0.82 |
| Start ART with less than 200 CD4+ T cells/μL of blood | 0.3928 | 0.2081 | 0.7413 | 0.004 |
| IL2 SNP | ||||
| rs2069762 A/A | Reference | |||
| rs2069762 A/C genotype | 0.6767 | 0.3709 | 1.2349 | 0.20 |
| rs2069762 C/C genotype | 8.5971 | 2.0590 | 35.8958 | 0.003 |
| IL4 SNP | ||||
| rs2243250 G/G genotype | Reference | |||
| rs2243250 A/G genotype | 0.5370 | 0.2290 | 1.2589 | 0.15 |
| rs2243250 A/A genotype | 0.7983 | 0.4057 | 1.5709 | 0.51 |
| ABCB1 SNP | ||||
| rs1128503 G/G genotype | Reference | |||
| rs1128503 A/G genotype | 0.4941 | 0.2060 | 1.1851 | 0.11 |
| rs1128503 A/A genotype | 0.2933 | 0.1479 | 0.5816 | 0.0004 |
| CYP3A4 SNP | ||||
| rs4646437 G/G genotype | Reference | |||
| rs4646437 A/G genotype | 1.9287 | 0.7274 | 5.1134 | 0.19 |
| rs4646437 A/A genotype | 0.9919 | 0.5277 | 1.8646 | 0.98 |
| CYP2B6 SNP | ||||
| rs707265 G/G genotype | Reference | |||
| rs707265 A/G genotype | 0.3201 | 0.0660 | 1.5532 | 0.16 |
| rs707265 A/A genotype | 0.7842 | 0.4252 | 1.4463 | 0.44 |
| Regimen containing AZT as NRTI option | 0.8751 | 0.3714 | 2.0621 | 0.76 |
| Regimen containing PI/r as third option | 1.8951 | 1.0258 | 3.5010 | 0.04 |
| Events of detectable plasma viral load (pVL≥50copies/mL) | 0.9953 | 0.9727 | 1.0183 | 0.68 |
ART, antiretroviral therapy; SNP, single nucleotide polymorphism; NRTI, nucleoside analog reverse transcriptase inhibitor; p, p-value; PI/r, protease inhibitor boosted with ritonavir.
ART, when taken correctly with good adherence, suppresses HIV-1 replication, decrease immune activation, favors immune recovery, and protects against opportunistic infections.36,37 However, some patients fail to recover CD4+ T cell numbers to normal or quasi-normal levels (immunological failure or non-response), being at risk for non-AIDS diseases, such as cardiovascular, kidney and liver disorders5 and premature aging.8,9 Thus, we performed a genetic association study through survival analysis to assess if polymorphisms in antiretroviral drugs pharmacodynamic pathways and immune system homeostasis were related with immunological failure in a sample from Recife, Northeast Brazil.
The observed prevalence of immunological non-response was 38.1%, which was is in concordance with some estimates found in the literature, ranging between 10% and 40%.38
Our sample comprises people with lower socioeconomic status with less access to sexual education and healthcare. The diagnosis of HIV-1 infection in this population is usually delayed or very delayed and, therefore, ART tend to be initiated when absolute CD4+ T cells counts are low, with advanced disease and presenting symptoms of opportunistic infections. A very compromised immune system by chronic HIV-1 infection predisposes to immunologic non-response,39 and indeed we observed that non-responders begun treatment with lower absolute CD4+ T cell counts, with almost half of them starting treatment with less than 200cells/μL.
Previous reviews also reported that male sex, older age38 and HCV coinfection are risk factors for immune non-response.40,41 We only found an association between male sex and immune failure in univariate analysis, but this association was lost in multivariate survival analysis. We also assessed HCV infection status alongside other agents (CMV, HBV, HTLV-1/2, toxoplasmosis, and syphilis), but the high prevalence of untested subjects for most of these infections hindered further analysis, since it could bias the results with sample size restriction. However, we believe that HCV and HTLV-1/2 had very low prevalence in our sample (no case of positive HTLV-1/2 and a single case of HCV infection among those available), and therefore they are unlikely to play a role on immunological outcome in the present study sample our sample. Moreover, no case of chronic HBV-infection was detected, whereas there were some individuals with anti-HBV immunity due to past infections and vaccination. We also found some individuals with latent CMV infection (positive IgG), a known causative agent of persistent immune activation,42 which can cause immune system exhaustion,43 but we cannot affirm if it was a factor favoring immune non-response in our sample, as it would be too speculative, since our serological data status was mostly lacking, as discussed above.
Sex and pre-ART CD4+ T cell counts were the only non-genetic differences between our study groups, since the individuals in our sample had similar ethnic backgrounds (as estimated by AIMs), and ART regimen types and distribution were alike between groups. Therefore, we expected to find genetic risk factors to immunologic non-response. We genotyped 46 candidate SNPs located in genes involved on antiretroviral drugs metabolism and transport and in genes involved on immune response. We found five SNPs associated – three with susceptibility to non-response and two with favorable response.
Two of the three SNPs associated with non-response are located in genes related to drug metabolism: CYP2B6 and ABCB1. The former is a protein from a membrane hemoprotein superfamily that is collectively involved in the metabolism of antiretroviral drugs and several others12 and the latter is a membrane active transport protein that ejects antiretroviral drugs from cells.44 The third is located at IL4 gene, which is involved in a polyfunctional immunoregulatory signal.45 One of two SNPs associated with favorable response is located at a gene related to immune system homeostasis, important for T and B cells proliferation, IL2,46 and the other is located in CYP3A4, another gene of drug-metabolizing CYP450 protein.12
We expected that SNPs in these genes would work in concert to affect gene function, altering distribution of antiretroviral drugs, and having deleterious consequences on immune function, leading to suboptimal immunological response to ART. However, all genetic associations were lost significance after multivariate survival analysis modeling. As other authors have not found associations focusing on the same or similar genes47 while others did have48 (for a review of previous genetic association studies, refer to38), more studies are necessary to unravel the genetic component of ART immunological non-response.
In conclusion, we performed a genetic association study looking for genetic variants that would explain suboptimal gains of CD4+ T cell counts in some individuals in a retrospective observational sample of individuals living with HIV-1 receiving ART from Northeast Brazil, and elaborated a multivariate statistical model for the prediction of immune response. More studies are necessary, in order to continuously refine the predictive model of immunological response, consequently improving HIV-1 infection care, and perhaps preventing complications seceondary to immunological non-response, such as systemic diseases and/or premature aging.
FundingThis work was supported by APQ-0568-2.02/10 and APQ-0599-2.02/14 grants and BFP-0018-2.02/17 scholarship from Fundação de Amparo à Ciência e Tecnologia de Pernambuco (FACEPE), 442225/2014-8 grant by Conselho Nacional de Desenvolvimento Científico e Tecnológico (CNPq) and BEX-7715/15-3; BEX-7711/15-8; BEX-7714/15-7 scholarships from Coordenação de Aperfeiçoamento de Pessoal de Nível Superior (CAPES). The authors thank the IRCCS Burlo Garofolo (Trieste, Italy) for Illumina VeraCode® analysis financial support.
Conflicts of interestThe authors declare no conflicts of interest.
The following are the supplementary data to this article:
